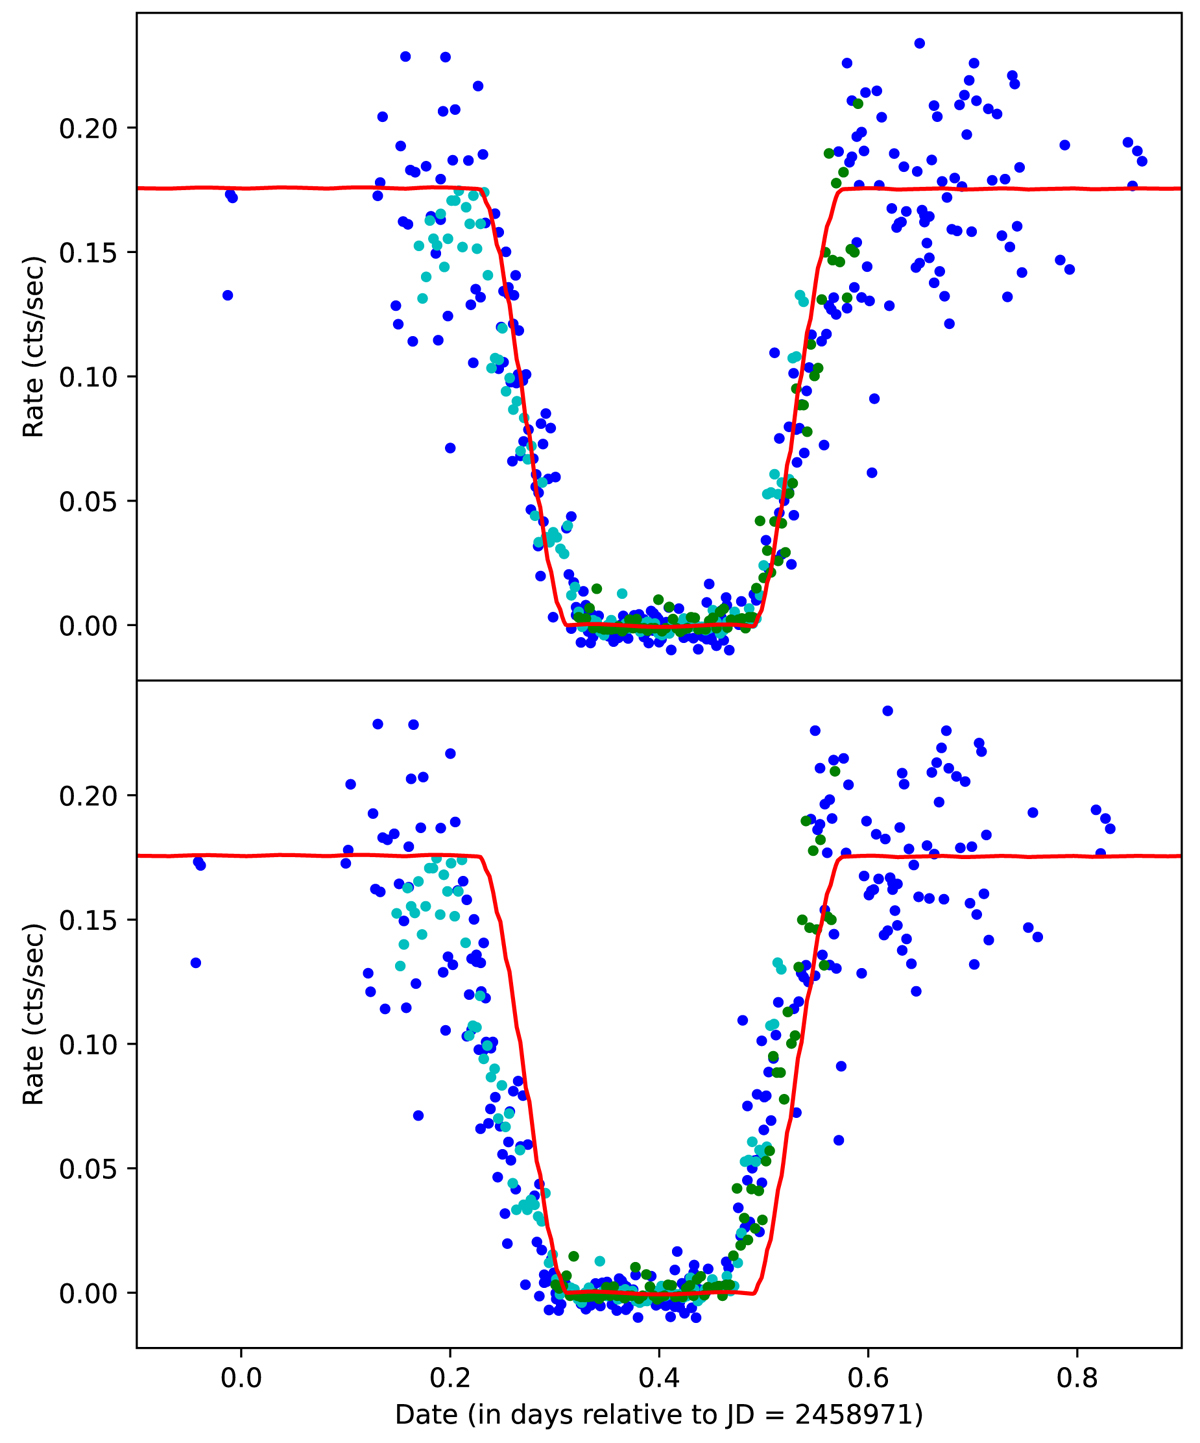
Fig. 8.
Download original image
X-ray secondary eclipse data shifted onto the scaled TESS light curve with best-fit secondary period, shown in the upper panel; blue data points refer to ROSAT data, green data points to XMM-Newton data, red curve is the best fit nightfall model to TESS; see text for details. Lower panel shows the same data as in upper panel, except that the periods between primary and secondary minima have been assumed to be identical. See text for details.
Current usage metrics show cumulative count of Article Views (full-text article views including HTML views, PDF and ePub downloads, according to the available data) and Abstracts Views on Vision4Press platform.
Data correspond to usage on the plateform after 2015. The current usage metrics is available 48-96 hours after online publication and is updated daily on week days.
Initial download of the metrics may take a while.