Open Access
Fig. 2.
Download original image
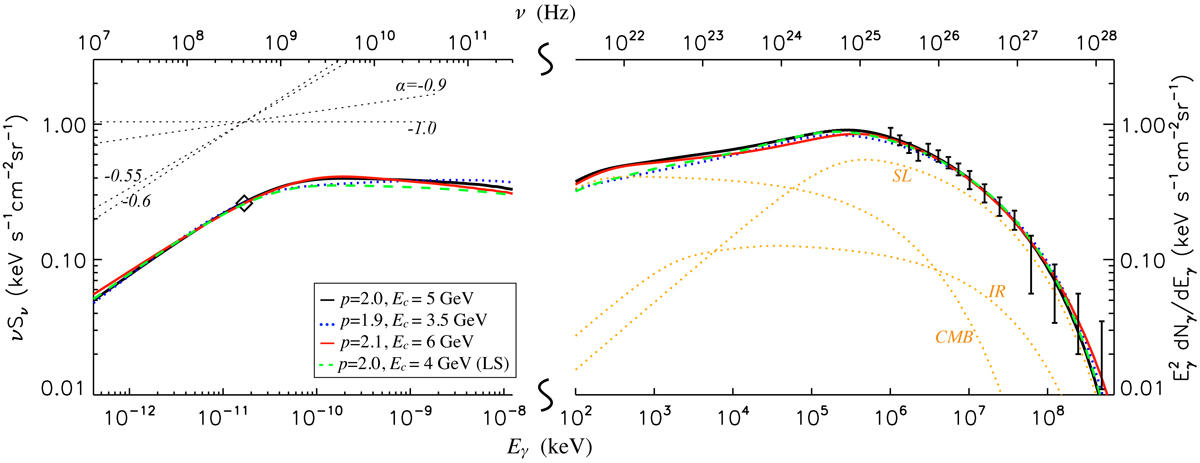
Modeling the radio and gamma-ray spectra for the NPS. The diamond and error bars indicate the radio intensity (408 MHz) and gamma-ray data (Jóhannesson & Porter 2021) of the NPS, respectively. The dotted orane lines indicate the contributions of different components of the ISRF for p = 2.0 (see Fig. A.1 for details).
Current usage metrics show cumulative count of Article Views (full-text article views including HTML views, PDF and ePub downloads, according to the available data) and Abstracts Views on Vision4Press platform.
Data correspond to usage on the plateform after 2015. The current usage metrics is available 48-96 hours after online publication and is updated daily on week days.
Initial download of the metrics may take a while.