Fig. 1.
Download original image
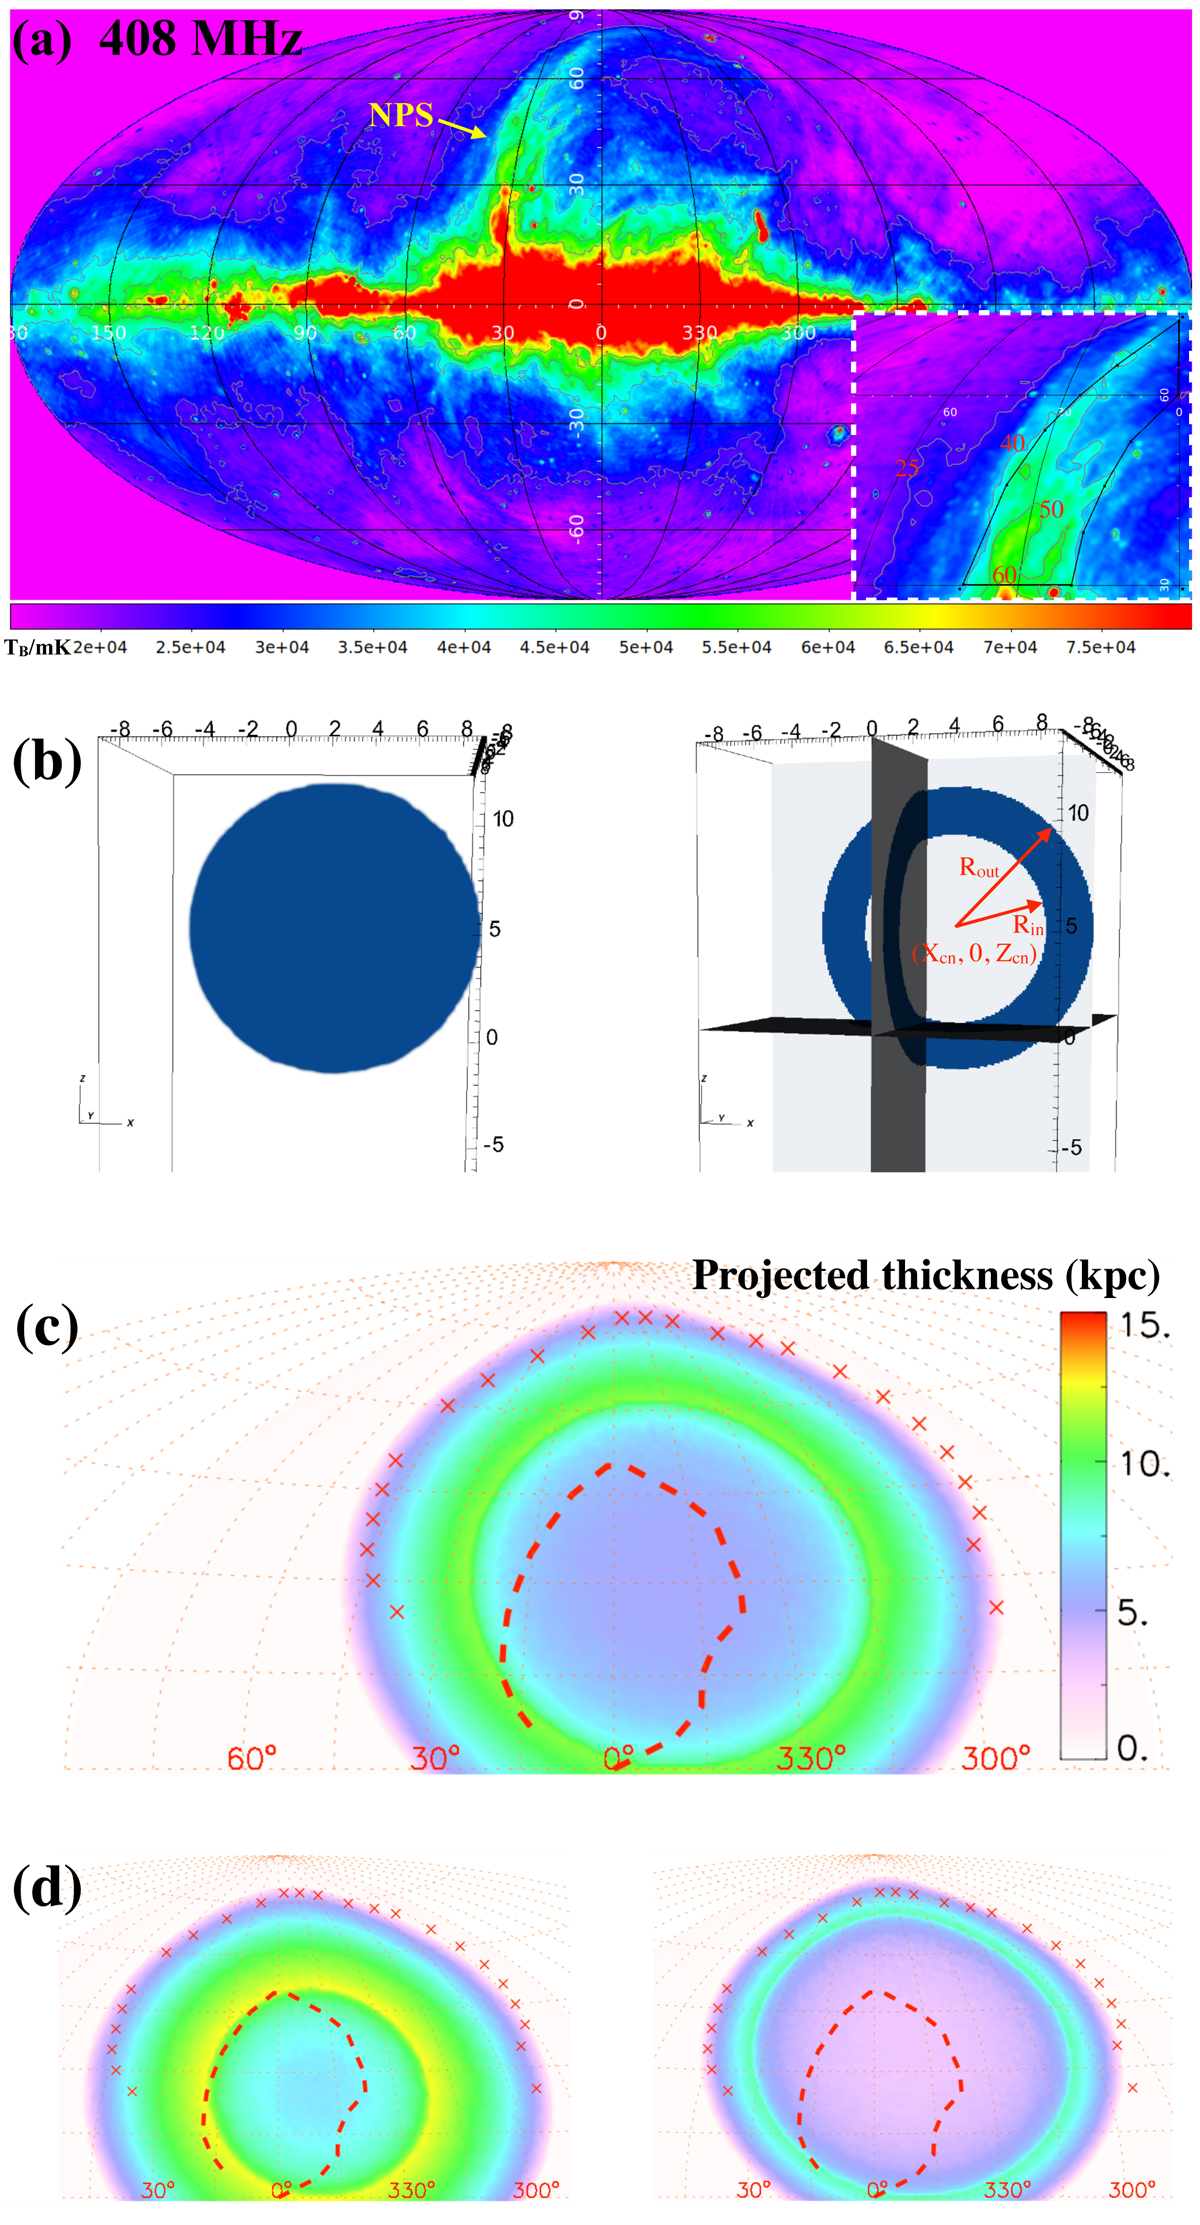
Observed NPS in the radio band and its geometry model. Panel a: 408 MHz sky map (Haslam et al. 1982, TB in mK). The gray contours indicate TB = 25 K, 40 K, 50 K, and 60 K. The right window shows the zoom-in view of the NPS, and the polygon marks the region for radio intensity statistics (similar to the region for gamma-ray analysis in Jóhannesson & Porter 2021). Panel b: 3D view and the three-slice view of the shell (coordinate values are in units of kpc). Panel c: projected thickness (Ds) of the radiative shell, accounting for the NPS/Loop I in Galactic coordinates with (Rin, Rout) = (5.0 kpc, 7.5 kpc). The crosses and the dashed line mark the outlines of Loop I and the northern Fermi bubble, respectively (see Su et al. 2010 for the coordinates). Panel d: projected thickness maps for (Rin, Rout) = (4.0 kpc, 7.5 kpc) (left) and (6.0 kpc, 7.5 kpc) (right).
Current usage metrics show cumulative count of Article Views (full-text article views including HTML views, PDF and ePub downloads, according to the available data) and Abstracts Views on Vision4Press platform.
Data correspond to usage on the plateform after 2015. The current usage metrics is available 48-96 hours after online publication and is updated daily on week days.
Initial download of the metrics may take a while.