Fig. 5.
Download original image
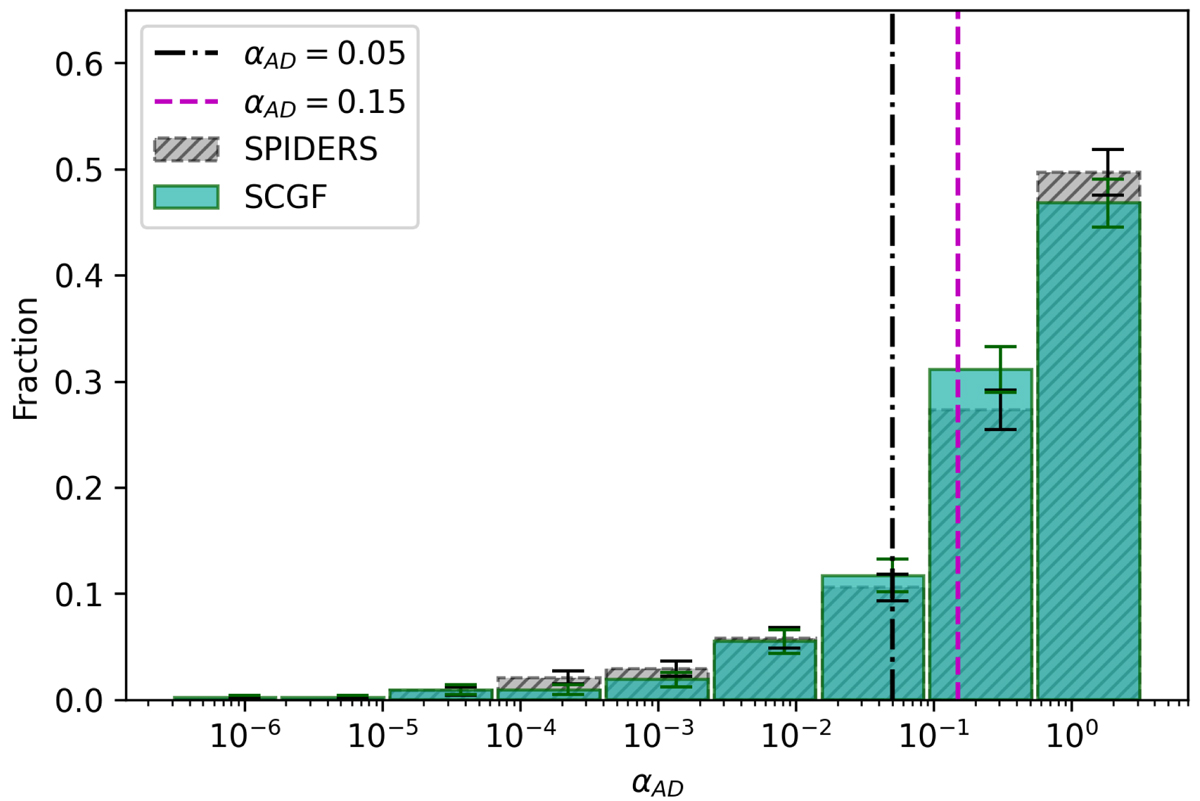
Distribution of clusters over the AD test αAD values for the SPIDERS and SCGF samples. The SPIDERS sample is marked with grey and dashed edges and SCGF with light blue and solid edges. The threshold limit for structure at αAD = 0.05 is marked with a dash-dotted black line, and the threshold for possible substructure αAD = 0.15 is marked with a dashed magenta line. The heights of the bars are calculated as the number of clusters per bin divided by the total number of clusters in the sample.
Current usage metrics show cumulative count of Article Views (full-text article views including HTML views, PDF and ePub downloads, according to the available data) and Abstracts Views on Vision4Press platform.
Data correspond to usage on the plateform after 2015. The current usage metrics is available 48-96 hours after online publication and is updated daily on week days.
Initial download of the metrics may take a while.