Fig. 27.
Download original image
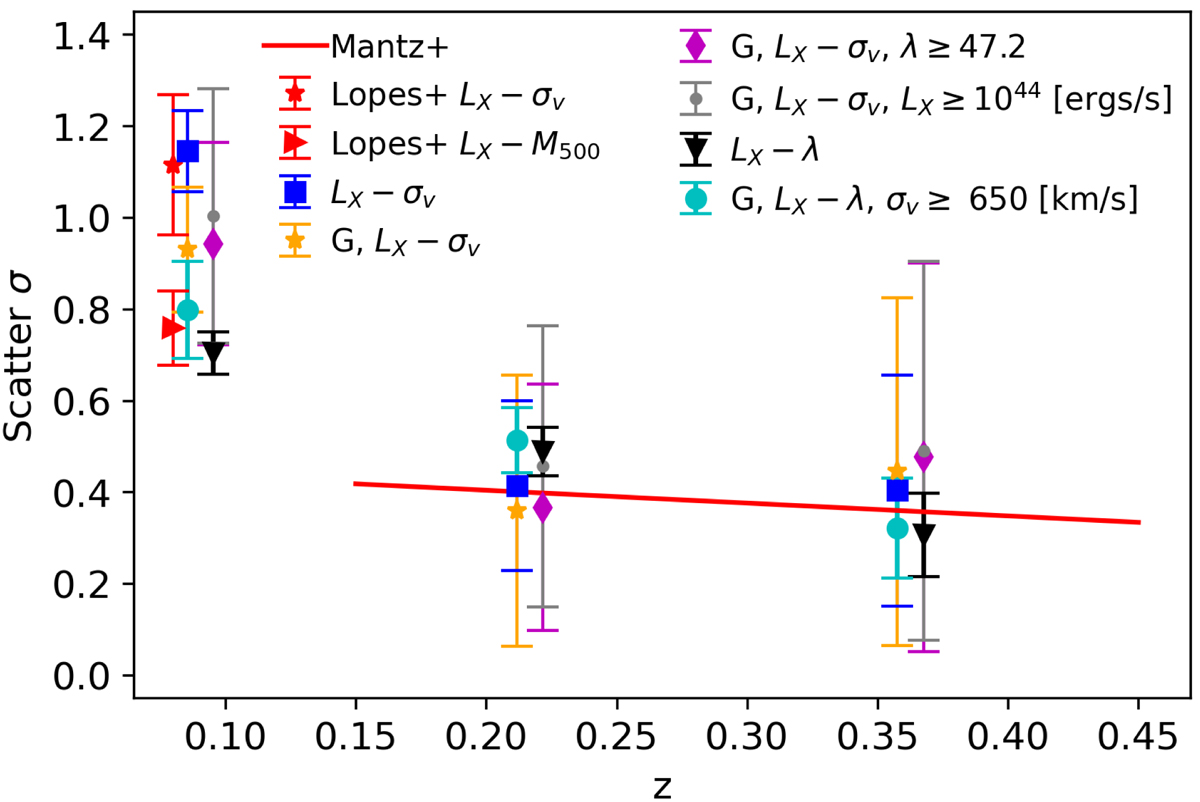
Redshift evolution of the intrinsic scatter of X-ray luminosity in scaling relations against optical mass proxies. The scatter of X-ray luminosity vs. velocity dispersion for the full sample is marked with blue squares, for the Gaussian sample with orange stars, for the Gaussian high-richness sample (λ ≥ 47.2) with magenta diamonds and the Gaussian high LX sample (LX ≥ 1044 ergs s−1) with small grey circles. The scatter of the X-ray luminosity vs. richness for the full sample is marked with black triangles and for the Gaussian high-velocity dispersion sample (σv ≥ 650 km s−1) with light blue circles. For comparison, we show the linear fit to the evolution of scatter in LX obtained using high-quality X-ray data on relaxed clusters from Mantz et al. (2016) with a red line. A larger scatter seen in our data at low redshifts is also seen in the analysis of Lopes et al. (2009). Lopes et al. (2009) X-ray luminosity vs. velocity dispersion relation at redshift z = 0.08 is marked with a red star, and their X-ray luminosity vs. M500 at the same redshift is marked with a red triangle.
Current usage metrics show cumulative count of Article Views (full-text article views including HTML views, PDF and ePub downloads, according to the available data) and Abstracts Views on Vision4Press platform.
Data correspond to usage on the plateform after 2015. The current usage metrics is available 48-96 hours after online publication and is updated daily on week days.
Initial download of the metrics may take a while.