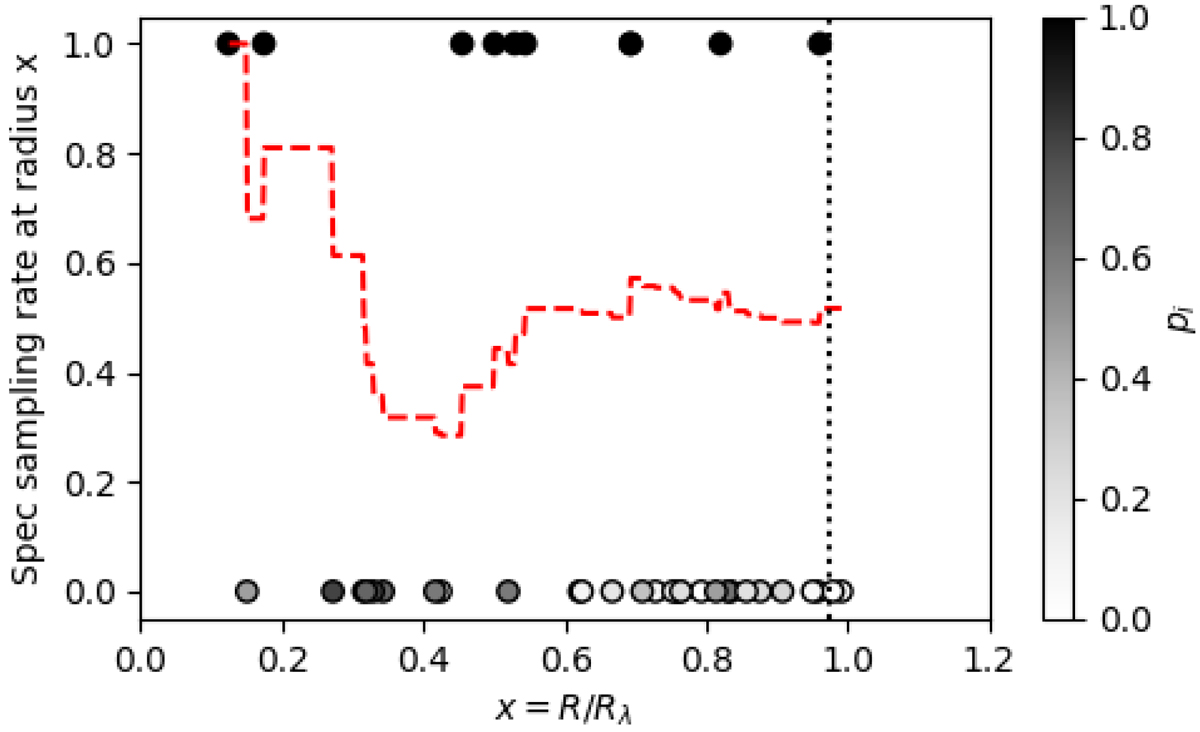
Fig. 2.
Download original image
Radial spectroscopic coverage of one confirmed cluster. Each filled circle represents one red-sequence galaxy with pmem > 0.05. The x-axis is their projected distance to the X-ray centre, normalized by Rλ. Spectroscopically identified members are displayed at y = 1 and coloured in black (pi = 1), and interlopers are displayed at y = 0 and coloured in white (pi = 0). Galaxies not assigned a spectroscopic redshift are coloured according to their pmem value (pi = pmem). The dashed red line shows the completeness rate, S(< x) (Eq. (1)) within radius x. The dotted line indicates the virial radius estimated from an X-ray luminosity–mass relation.
Current usage metrics show cumulative count of Article Views (full-text article views including HTML views, PDF and ePub downloads, according to the available data) and Abstracts Views on Vision4Press platform.
Data correspond to usage on the plateform after 2015. The current usage metrics is available 48-96 hours after online publication and is updated daily on week days.
Initial download of the metrics may take a while.