Open Access
Fig. 19.
Download original image
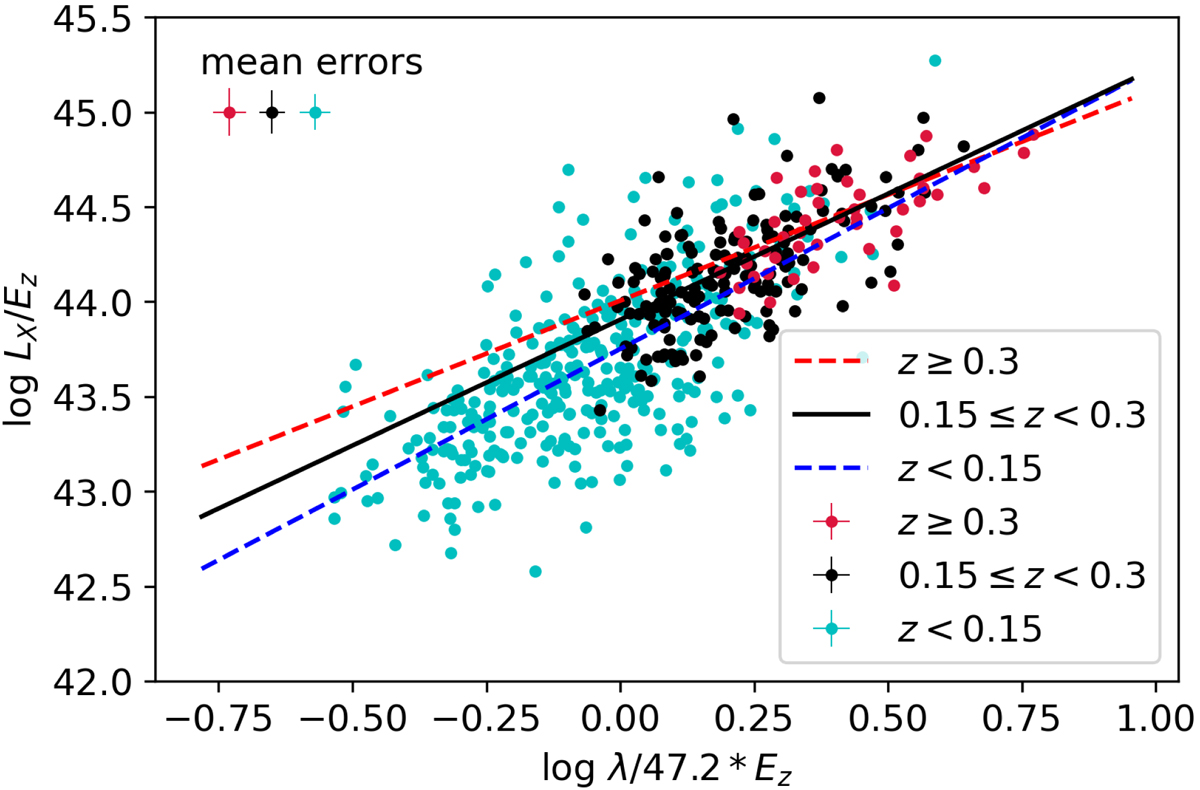
Redshift evolution of X-ray luminosity vs. richness scaling relations for the SCGF sample. The z ≥ 0.3 sample is marked with red, the 0.15 ≤ z < 0.3 sample with black, and the z < 0.15 sample with light blue.
Current usage metrics show cumulative count of Article Views (full-text article views including HTML views, PDF and ePub downloads, according to the available data) and Abstracts Views on Vision4Press platform.
Data correspond to usage on the plateform after 2015. The current usage metrics is available 48-96 hours after online publication and is updated daily on week days.
Initial download of the metrics may take a while.