Fig. 18.
Download original image
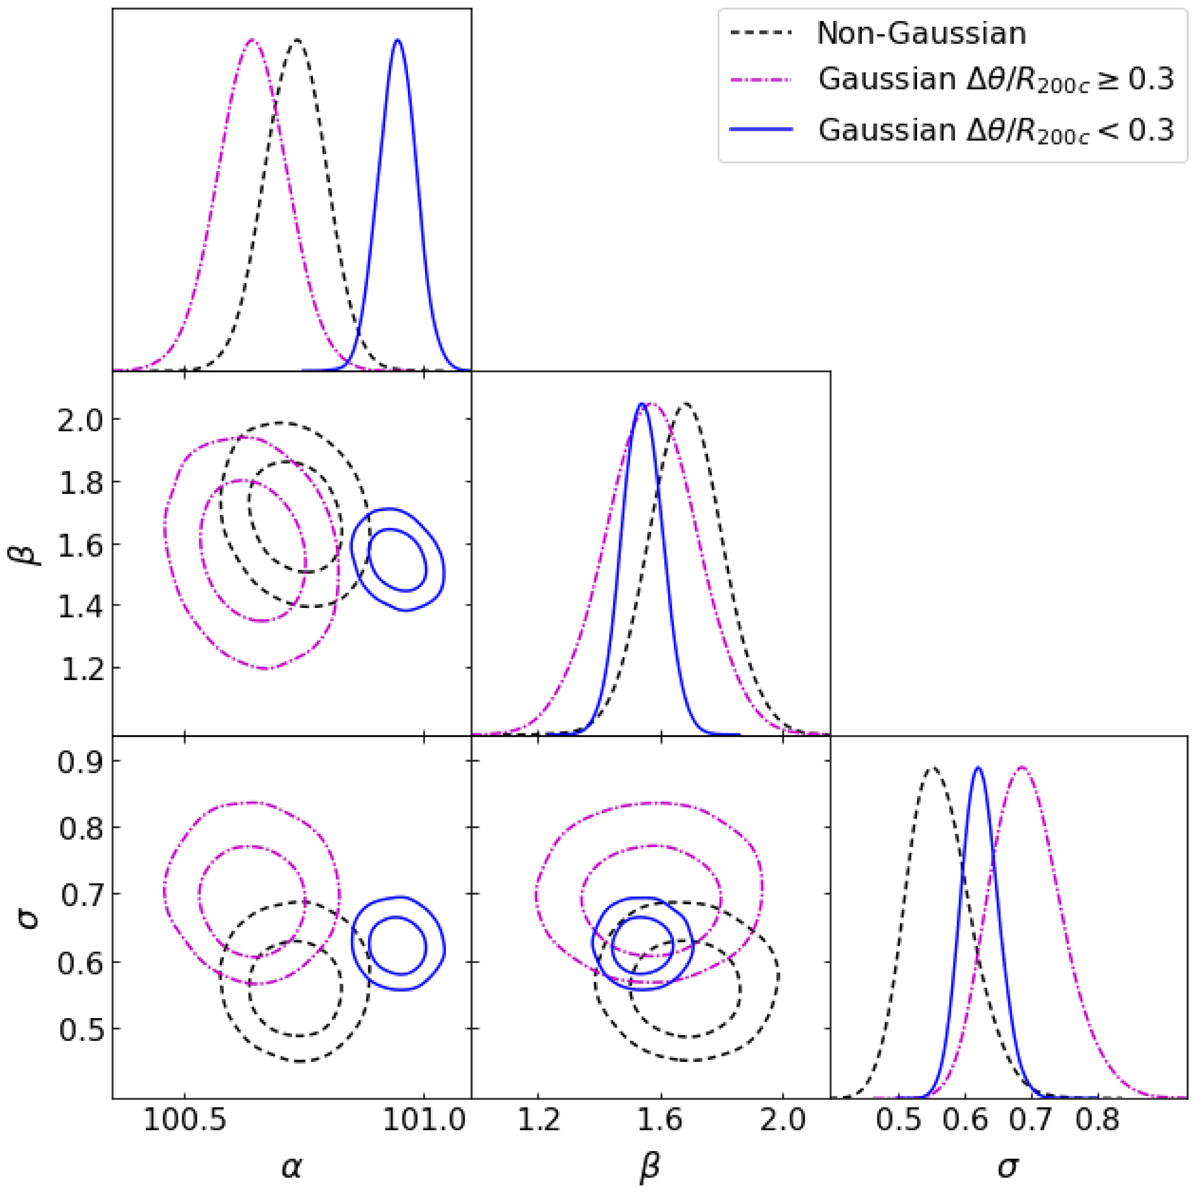
Effect of the offset between X-ray and optical centres on the X-ray luminosity vs. richness scaling relation for the SCGF Gaussian subsample. The parameters of the scaling relations for the non-Gaussian sample are shown in dashed black lines, small offset clusters – in solid blue lines and large offset clusters – in dash-dotted magenta lines. The separation is done at 0.3 R200c. Other details are the same as in Fig. 12.
Current usage metrics show cumulative count of Article Views (full-text article views including HTML views, PDF and ePub downloads, according to the available data) and Abstracts Views on Vision4Press platform.
Data correspond to usage on the plateform after 2015. The current usage metrics is available 48-96 hours after online publication and is updated daily on week days.
Initial download of the metrics may take a while.