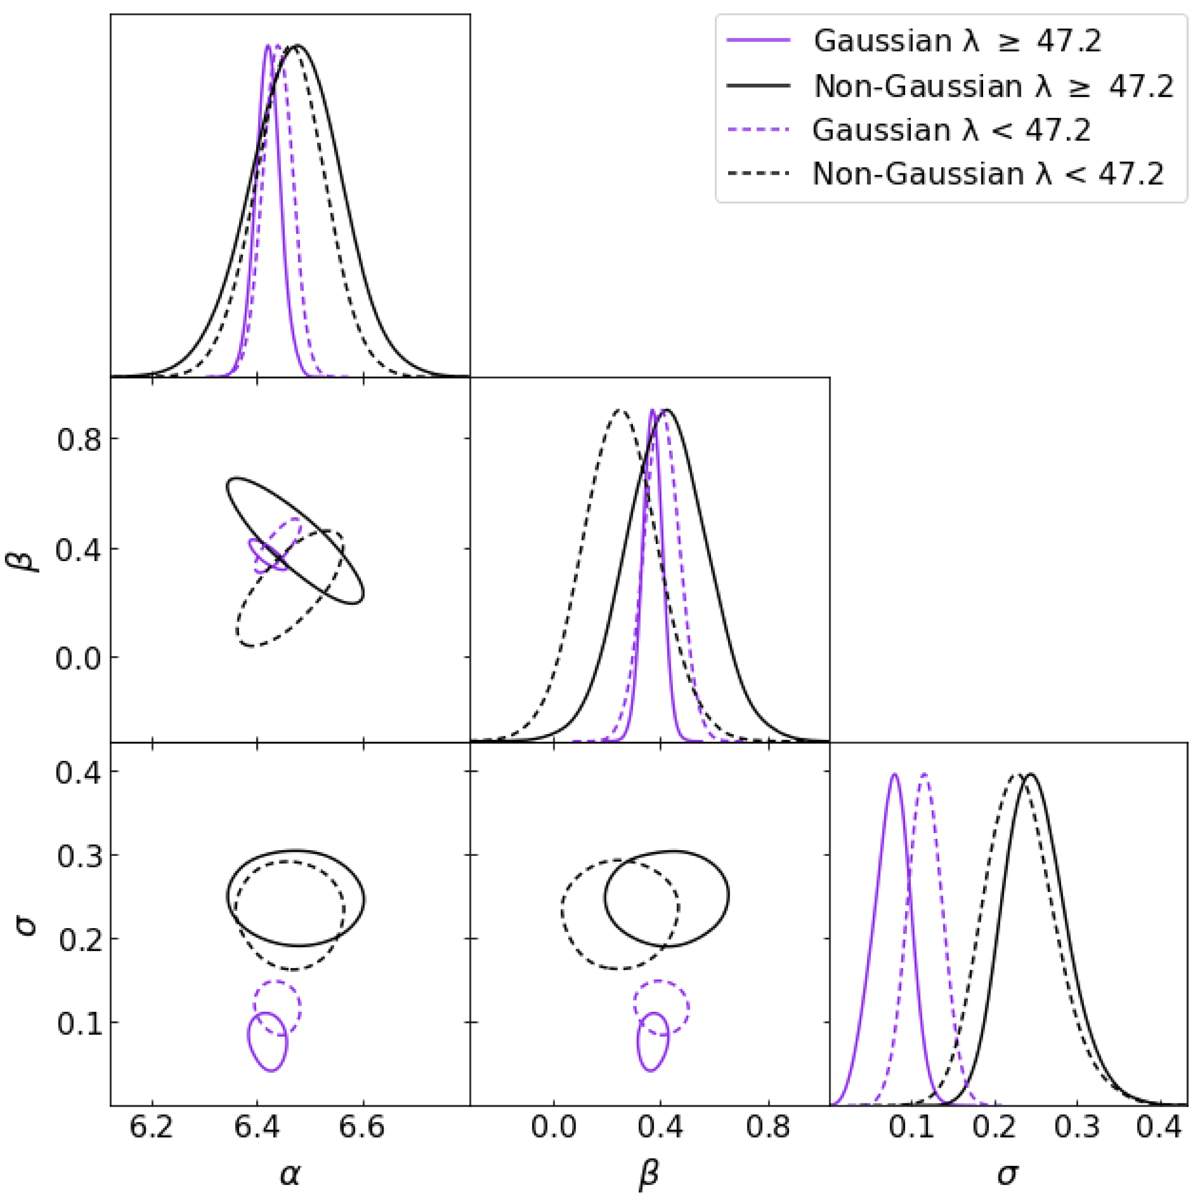
Fig. 15.
Download original image
Reducing the effect of the complexity of scaling relations on the inferred scatter between velocity dispersion and richness. Contours show 68% confidence levels. Gaussian clusters are marked with purple lines and non-Gaussian clusters with black lines. The high-richness sample is marked with solid lines and the low-richness sample with dashed lines. Other details are the same as in Fig. 12.
Current usage metrics show cumulative count of Article Views (full-text article views including HTML views, PDF and ePub downloads, according to the available data) and Abstracts Views on Vision4Press platform.
Data correspond to usage on the plateform after 2015. The current usage metrics is available 48-96 hours after online publication and is updated daily on week days.
Initial download of the metrics may take a while.