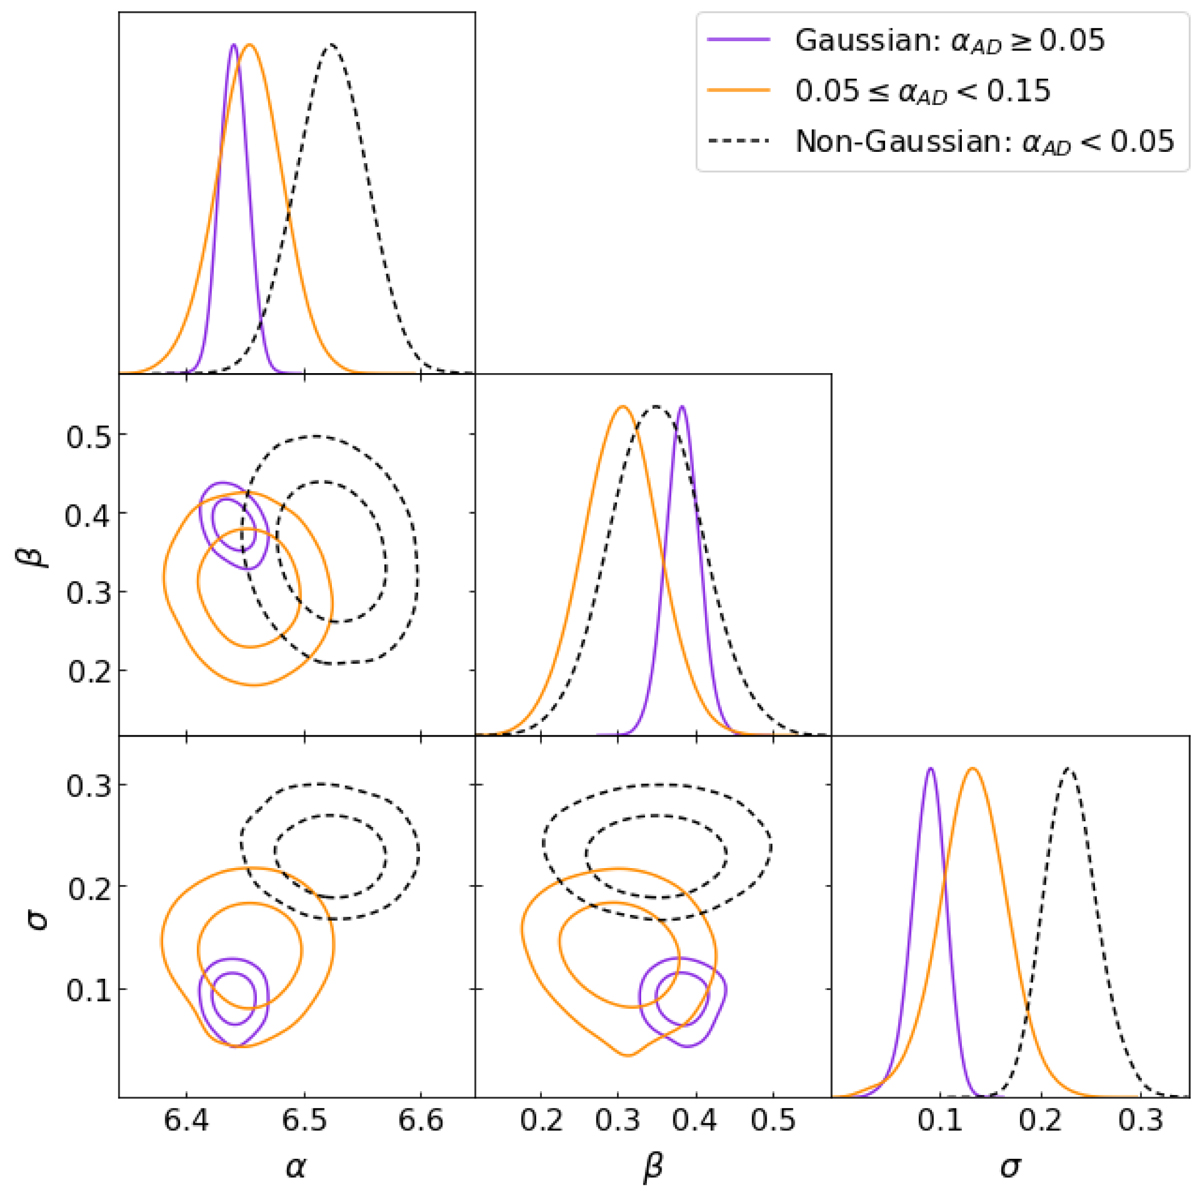
Fig. 12.
Download original image
Effect of velocity substructure on the velocity dispersion – richness scaling relation for the SCGF catalogue with a different range of αAD values. α stands for intercept, β – for slope and σ – for the intrinsic scatter. 2D contours show the 68% and 95% significance levels. Gaussian clusters are marked with solid purple lines and non-Gaussian clusters with dashed black lines. Solid orange lines show the cluster population with a marginal probability of having a substructure (between 85% and 95% confidence level).
Current usage metrics show cumulative count of Article Views (full-text article views including HTML views, PDF and ePub downloads, according to the available data) and Abstracts Views on Vision4Press platform.
Data correspond to usage on the plateform after 2015. The current usage metrics is available 48-96 hours after online publication and is updated daily on week days.
Initial download of the metrics may take a while.