Fig. 11.
Download original image
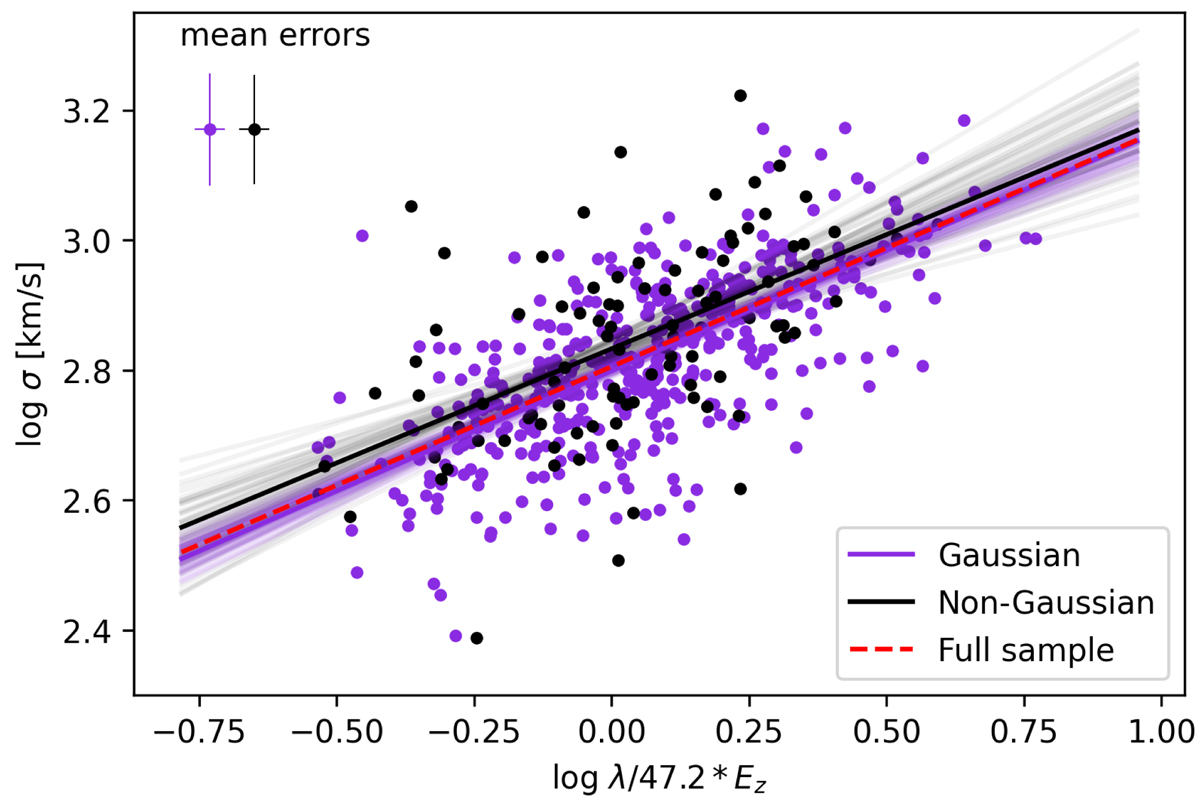
Velocity dispersion vs. richness for the SCGF sample with scaling relations overplotted. Data points for Gaussian clusters are marked with purple dots and for non-Gaussian with black dots with 1σ errors on both axes. Purple lines show the fits for Gaussian clusters, black lines – for non-Gaussian clusters and the red dashed line – for the median of the full sample. The thin lines display 0.5% of all the linmix MCMC chains. For the bold lines, we take the median values for each sample.
Current usage metrics show cumulative count of Article Views (full-text article views including HTML views, PDF and ePub downloads, according to the available data) and Abstracts Views on Vision4Press platform.
Data correspond to usage on the plateform after 2015. The current usage metrics is available 48-96 hours after online publication and is updated daily on week days.
Initial download of the metrics may take a while.