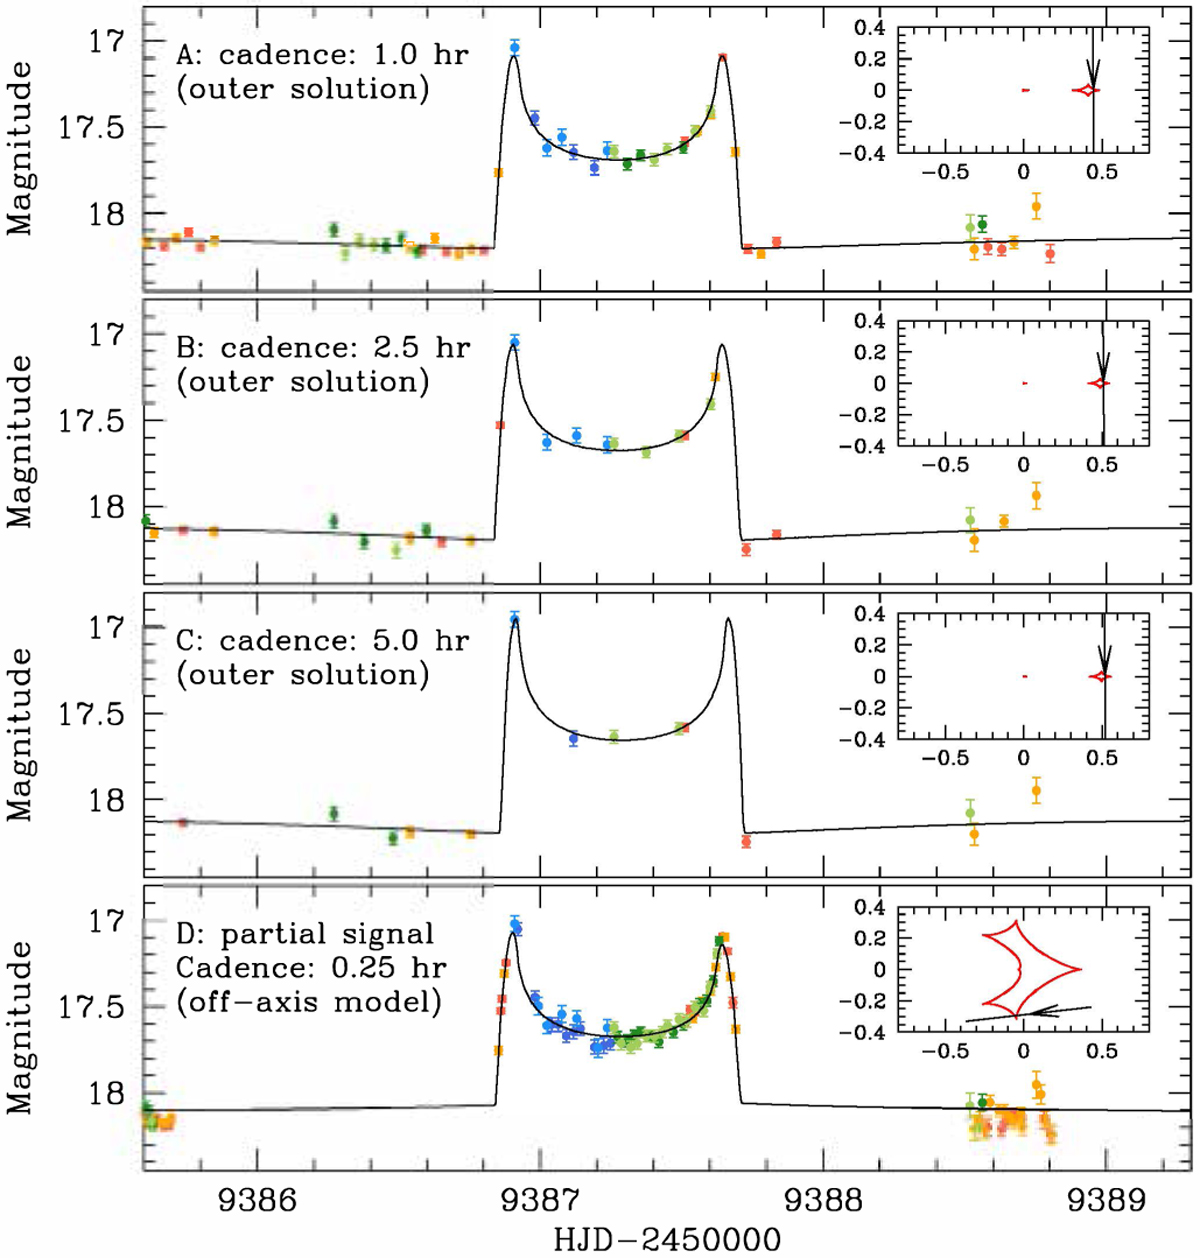
Fig. 8
Download original image
Four sets of mock data. The data sets in the top three panels mimic those obtained with a 1.0, a 2.5, and a 5.0 h cadence, and the data set in the bottom panel simulates partially covered data. The inset in each panel shows the lens-system configuration of the solution found from modeling, and the solid curve drawn on the data points is the model curve.
Current usage metrics show cumulative count of Article Views (full-text article views including HTML views, PDF and ePub downloads, according to the available data) and Abstracts Views on Vision4Press platform.
Data correspond to usage on the plateform after 2015. The current usage metrics is available 48-96 hours after online publication and is updated daily on week days.
Initial download of the metrics may take a while.