Fig. 5
Download original image
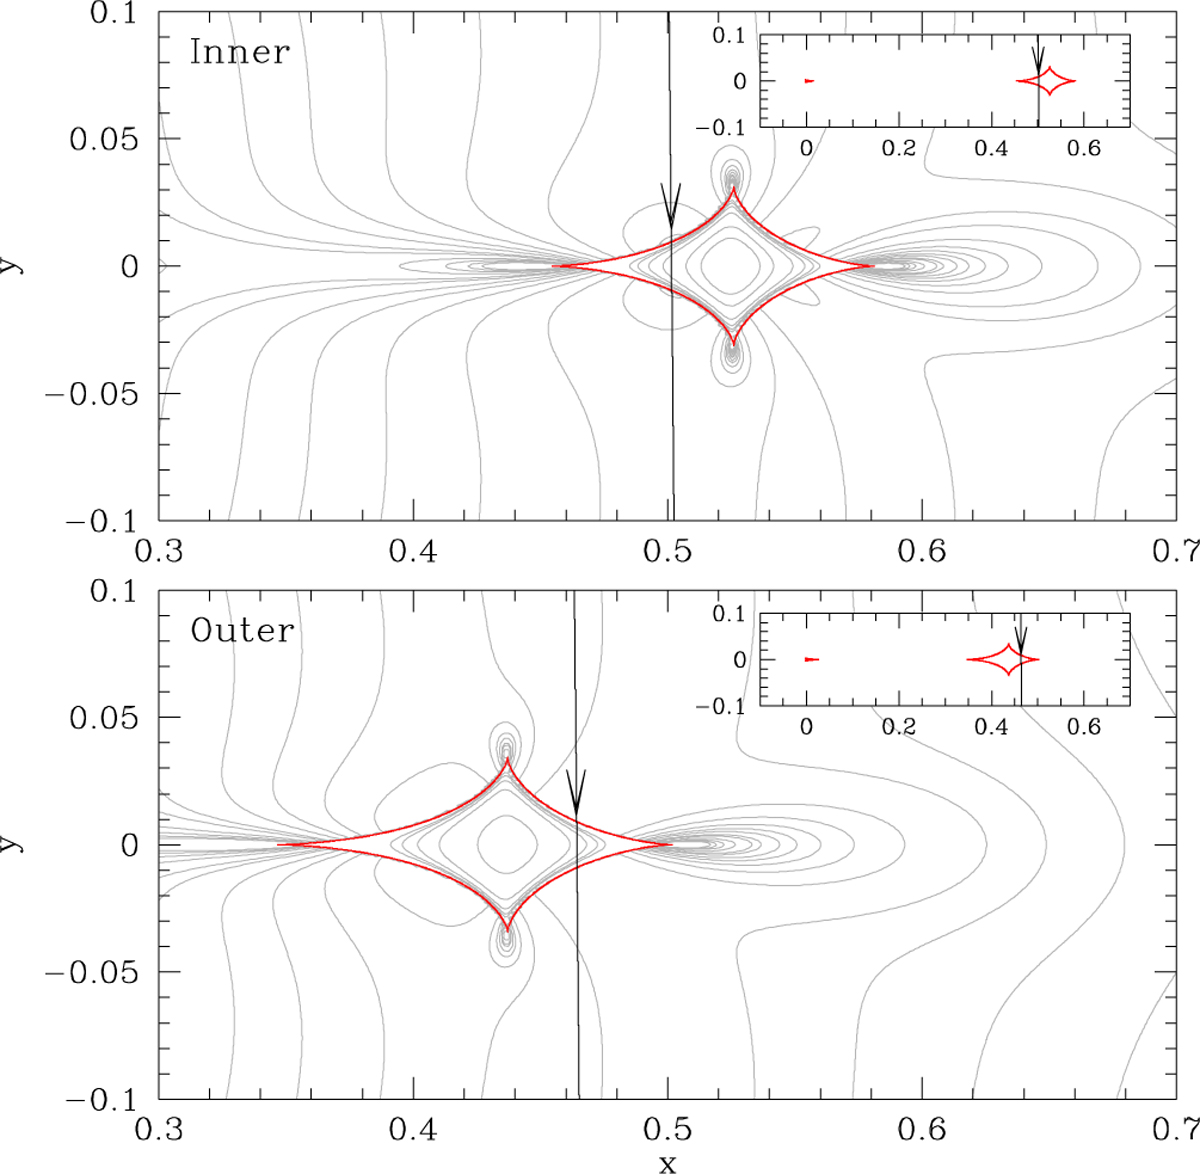
Lens-system configurations of the inner (upper panel) and outer (lower panel) solutions. The inset in each panel shows the whole view of the caustic (red figures), and the main panel shows a zoomed-in view around the planetary caustic. The arrowed line represents the source trajectory, and the gray curves encompassing the caustic are equi-magnification contours.
Current usage metrics show cumulative count of Article Views (full-text article views including HTML views, PDF and ePub downloads, according to the available data) and Abstracts Views on Vision4Press platform.
Data correspond to usage on the plateform after 2015. The current usage metrics is available 48-96 hours after online publication and is updated daily on week days.
Initial download of the metrics may take a while.