Open Access
Fig. 3
Download original image
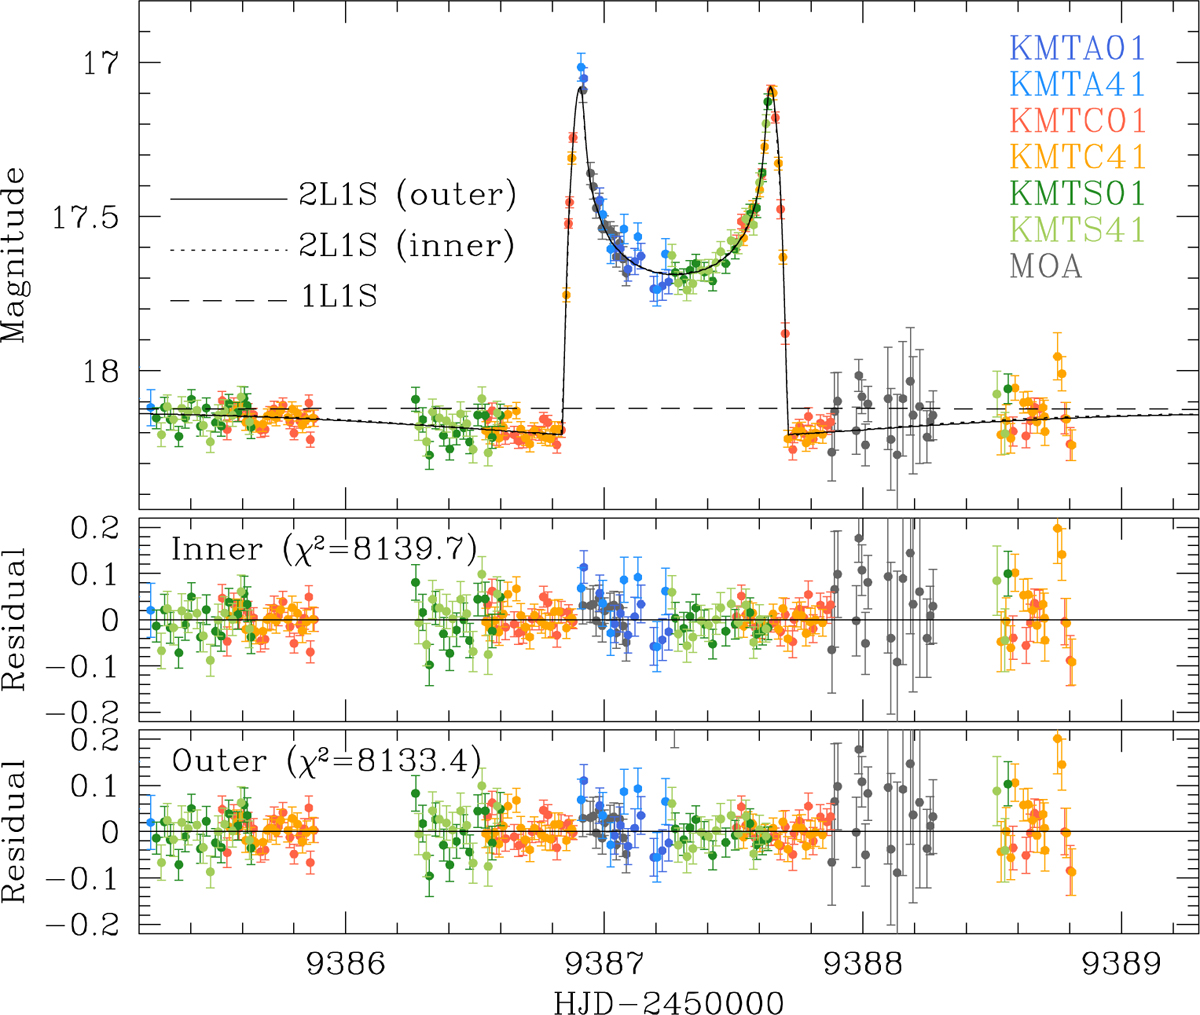
Enlarged view around the region of the anomaly. The dashed, dotted, and solid curves represent the models of the 1L1S, inner 2L1S, and outer 2L1S solutions, respectively. We note that the model curves of the inner and outer 2L1S solutions are so similar that it is difficult to resolve them with the given line width.
Current usage metrics show cumulative count of Article Views (full-text article views including HTML views, PDF and ePub downloads, according to the available data) and Abstracts Views on Vision4Press platform.
Data correspond to usage on the plateform after 2015. The current usage metrics is available 48-96 hours after online publication and is updated daily on week days.
Initial download of the metrics may take a while.