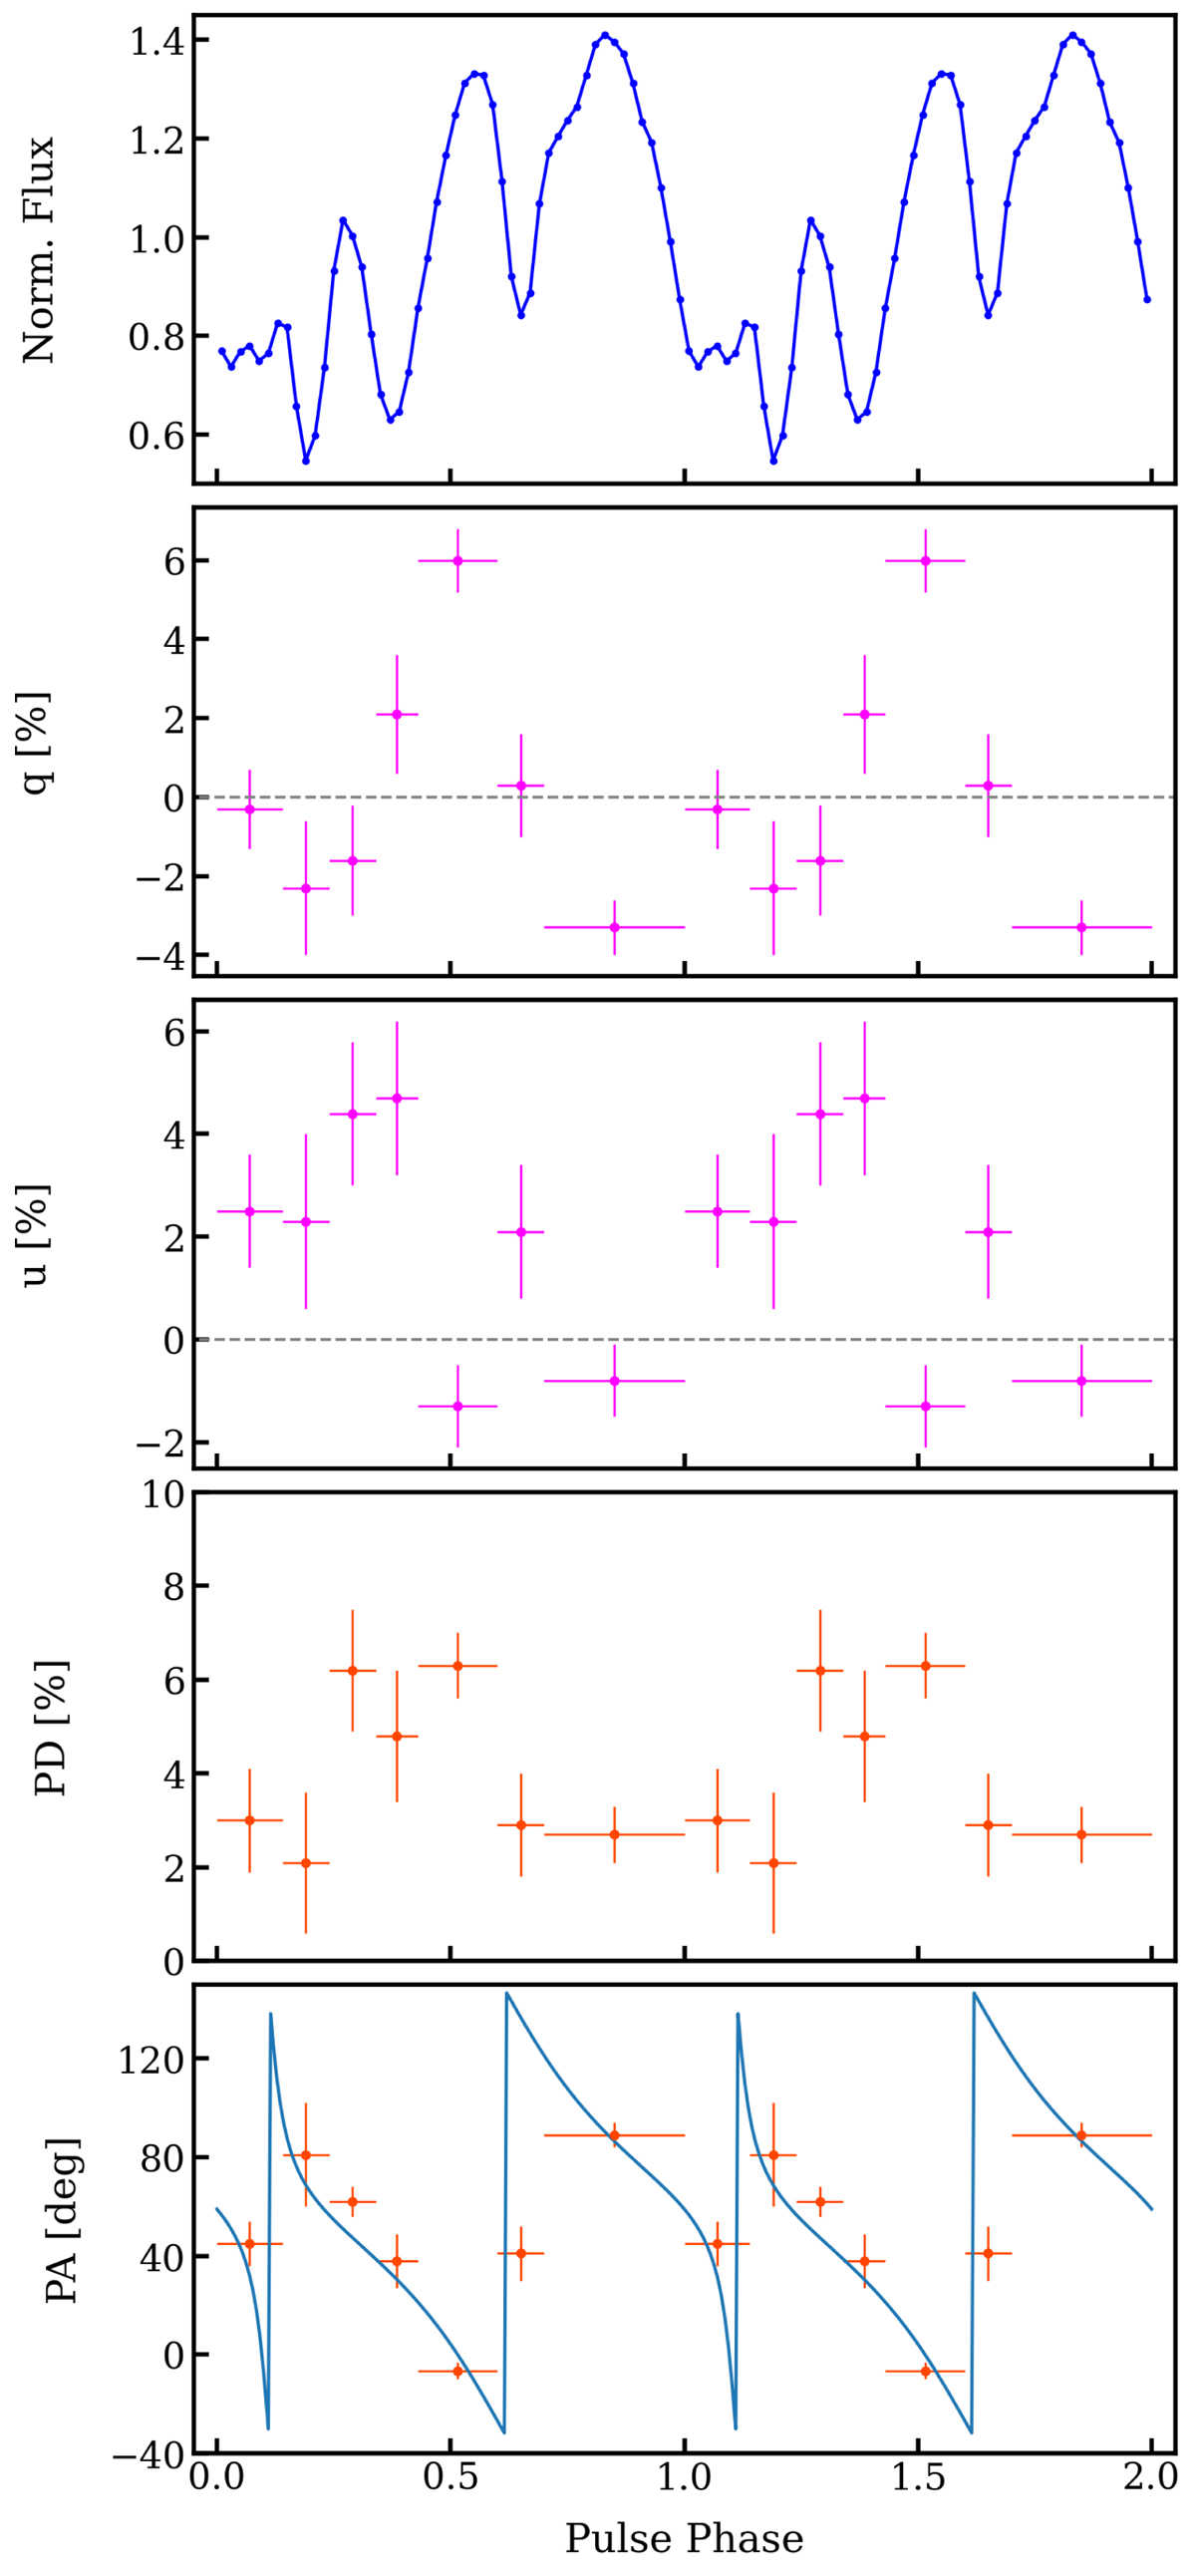
Fig. 6.
Download original image
Phase-resolved results of EXO 2030+375 in the 2–8 keV range, combining data from all IXPE DUs. From top to bottom, we show the pulse profile, normalized Stokes parameters q and u based on the polarimetric analysis, and the PD and PA, as obtained from the spectro-polarimetric analysis. The blue line in the PA panel corresponds to the best-fit rotating vector model (see Sect. 4.2).
Current usage metrics show cumulative count of Article Views (full-text article views including HTML views, PDF and ePub downloads, according to the available data) and Abstracts Views on Vision4Press platform.
Data correspond to usage on the plateform after 2015. The current usage metrics is available 48-96 hours after online publication and is updated daily on week days.
Initial download of the metrics may take a while.