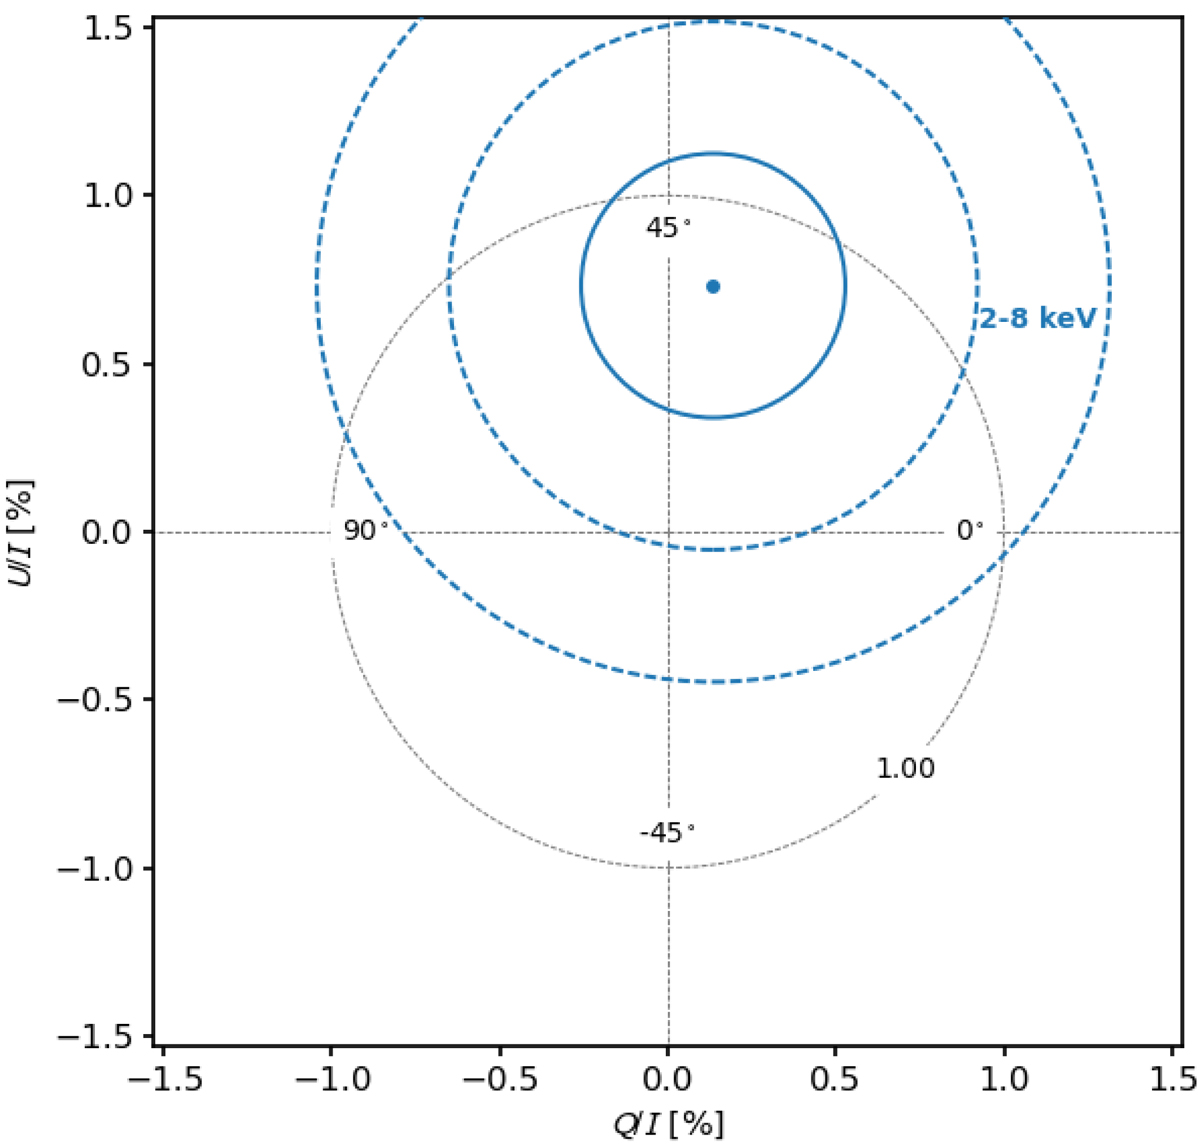
Fig. 2.
Download original image
Pulse phase-averaged normalized Stokes parameters U/I (y-axis) and Q/I (x-axis) over the 2–8 keV energy range. The 1σ, 2σ, and 3σ contours are plotted as concentric circles around the nominal value (continuous and dashed lines, respectively). The gray dotted circle represents loci of constant 1% PD, while radial lines are labeled for specific electric vector position angles (that is, the polarization angle, PA) with respect to north. The phase-averaged PD upper limit is about 2% at 99% c.l.
Current usage metrics show cumulative count of Article Views (full-text article views including HTML views, PDF and ePub downloads, according to the available data) and Abstracts Views on Vision4Press platform.
Data correspond to usage on the plateform after 2015. The current usage metrics is available 48-96 hours after online publication and is updated daily on week days.
Initial download of the metrics may take a while.