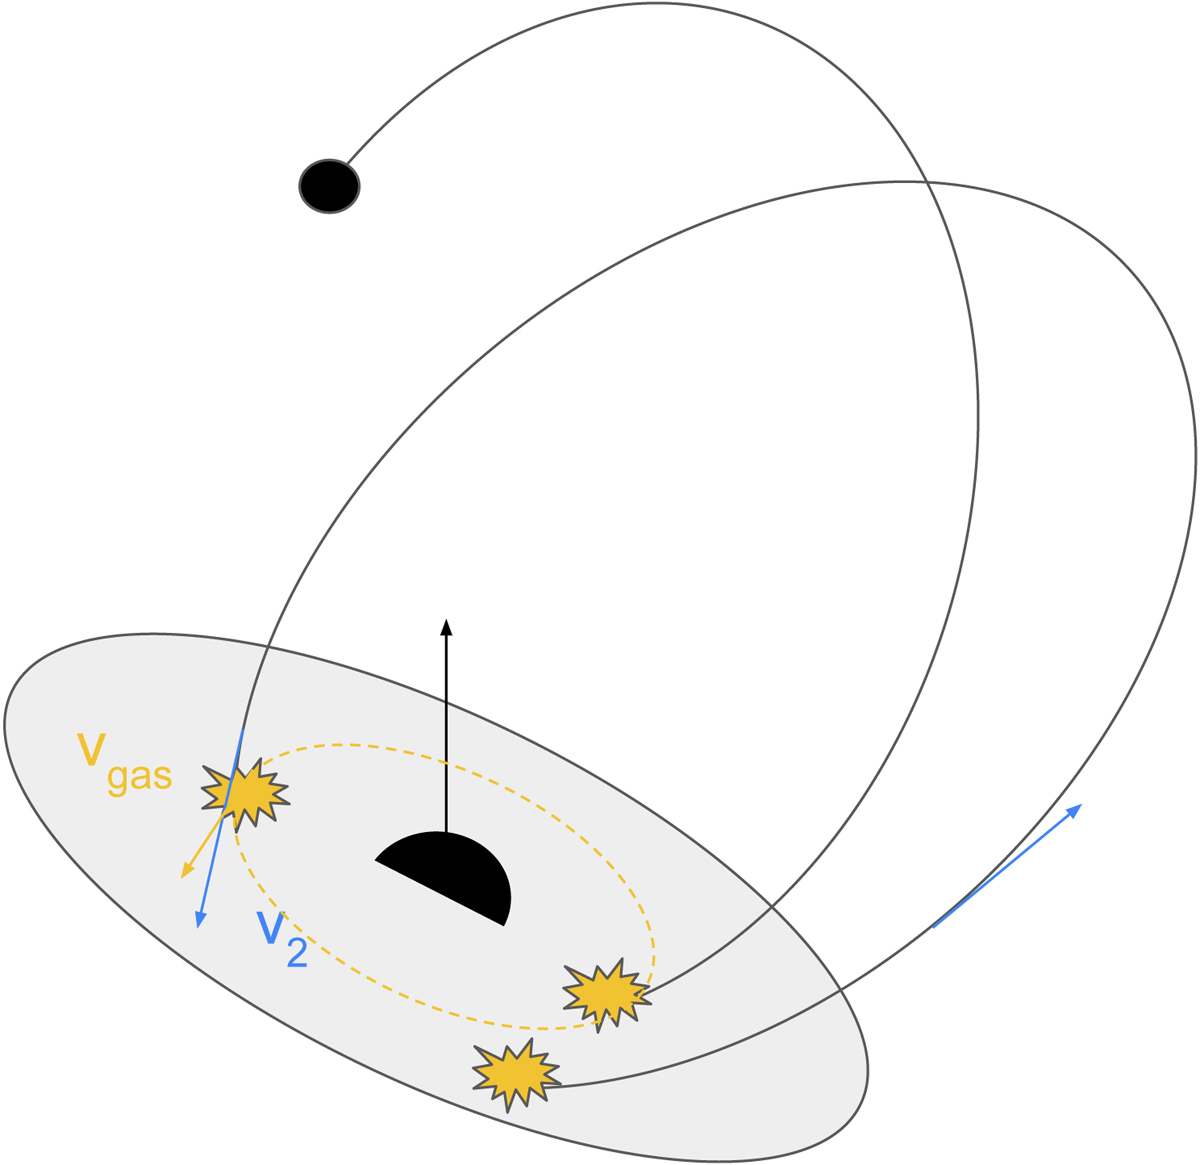
Fig. 1.
Download original image
Schematic view of the model where the central big black dot represents the primary MBH, the small black dot represents the EMRI companion, the grey area represents the tilted disc and the EMRI-disc crossings are shown with yellow stars. The vertical arrow shows the MBH spin vector. The misalignment between the EMRI orbit and the disc is enhanced in this cartoon with the purpose of showing the impacts more clearly. However, we use smaller misalignments to produce the QPEs light curves. The blue and yellow arrows show the EMRI and gas velocity vectors, respectively, while the yellow dashed line only mimics an orbit inside the disc.
Current usage metrics show cumulative count of Article Views (full-text article views including HTML views, PDF and ePub downloads, according to the available data) and Abstracts Views on Vision4Press platform.
Data correspond to usage on the plateform after 2015. The current usage metrics is available 48-96 hours after online publication and is updated daily on week days.
Initial download of the metrics may take a while.