Fig. 9

Download original image
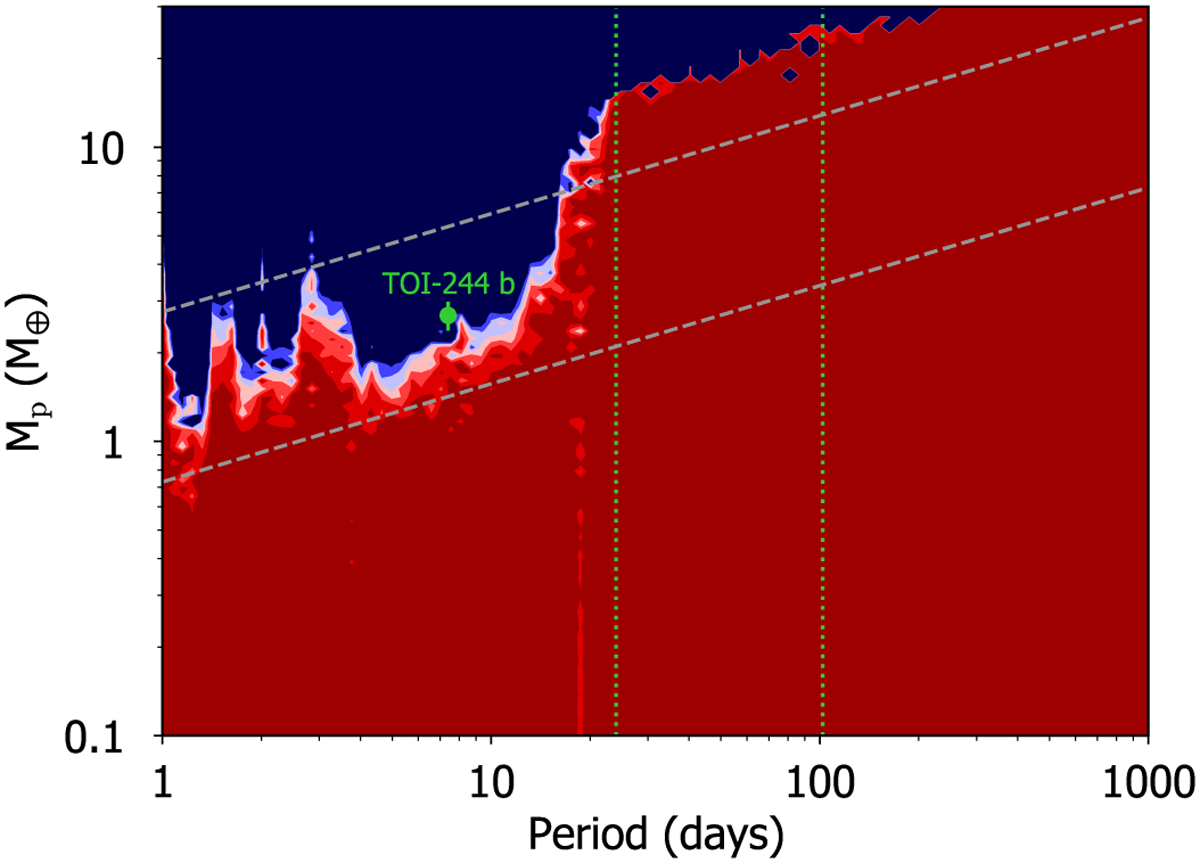
Detectability map for the ESPRESSO+HARPS data set obtained from the injection-recovery test. The redder values correspond to false alarm probabilities (FAPs) larger than 1% while the blue color indicates that the signal is recovered with FAP < 1%. The location of TOI-244 b is indicated by the green symbol. The green dotted vertical lines indicate the optimistic HZ around GJ 1018 according to Kopparapu et al. (2013). The bottom dashed line indicates the limit imposed by the median radial velocity uncertainty of the original data set (i.e., before removing the planet and activity contribution) while the upper dashed line indicates the limit corresponding to the rms of the data.
Current usage metrics show cumulative count of Article Views (full-text article views including HTML views, PDF and ePub downloads, according to the available data) and Abstracts Views on Vision4Press platform.
Data correspond to usage on the plateform after 2015. The current usage metrics is available 48-96 hours after online publication and is updated daily on week days.
Initial download of the metrics may take a while.


