Fig. 9.
Download original image
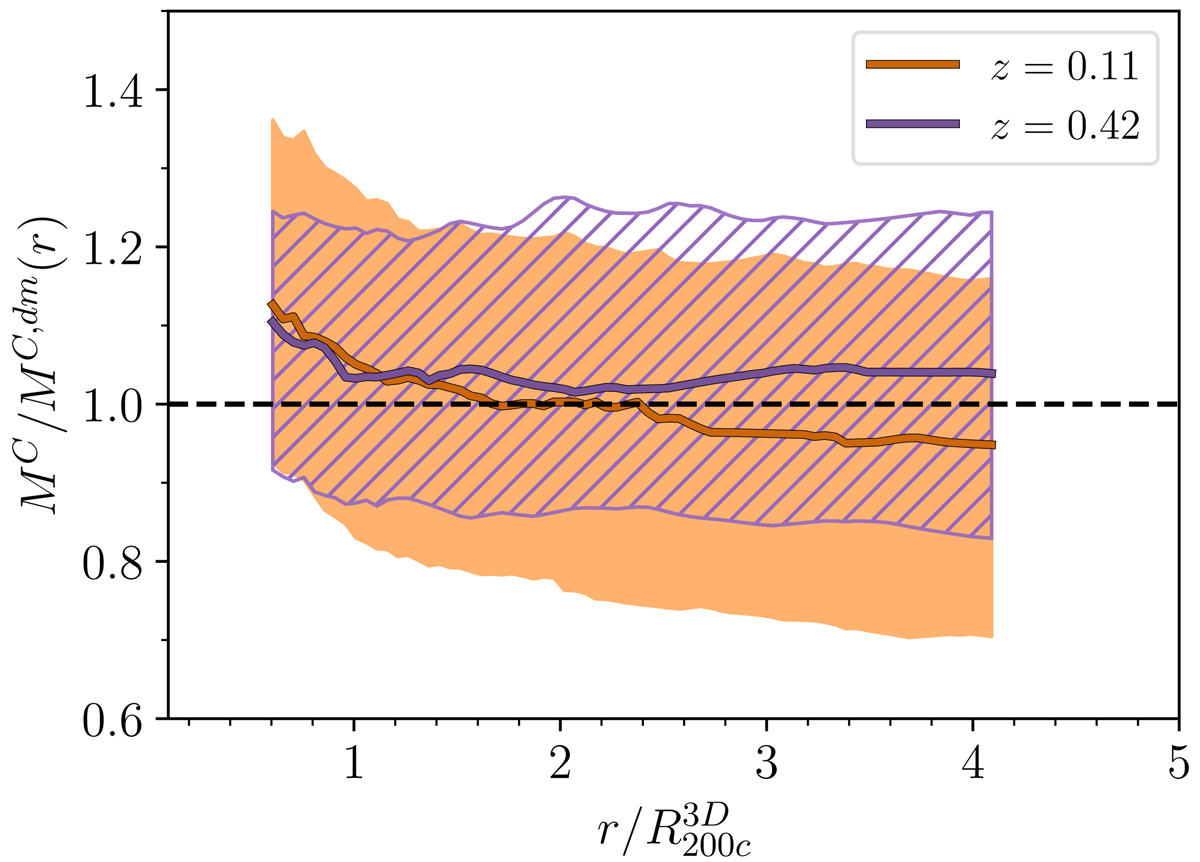
Ratio between caustic profiles based on simulated galaxies and dark matter, for clusters at z = 0.11 (orange) and z = 0.42 (violet). Solid curves show the median radial profile of the mass ratios. The shaded regions areas show the interquartile range. The black dashed line shows MC(r) = MC, dm(r). We scale both profiles by ![]() .
.
Current usage metrics show cumulative count of Article Views (full-text article views including HTML views, PDF and ePub downloads, according to the available data) and Abstracts Views on Vision4Press platform.
Data correspond to usage on the plateform after 2015. The current usage metrics is available 48-96 hours after online publication and is updated daily on week days.
Initial download of the metrics may take a while.