Open Access
Fig. 6.
Download original image
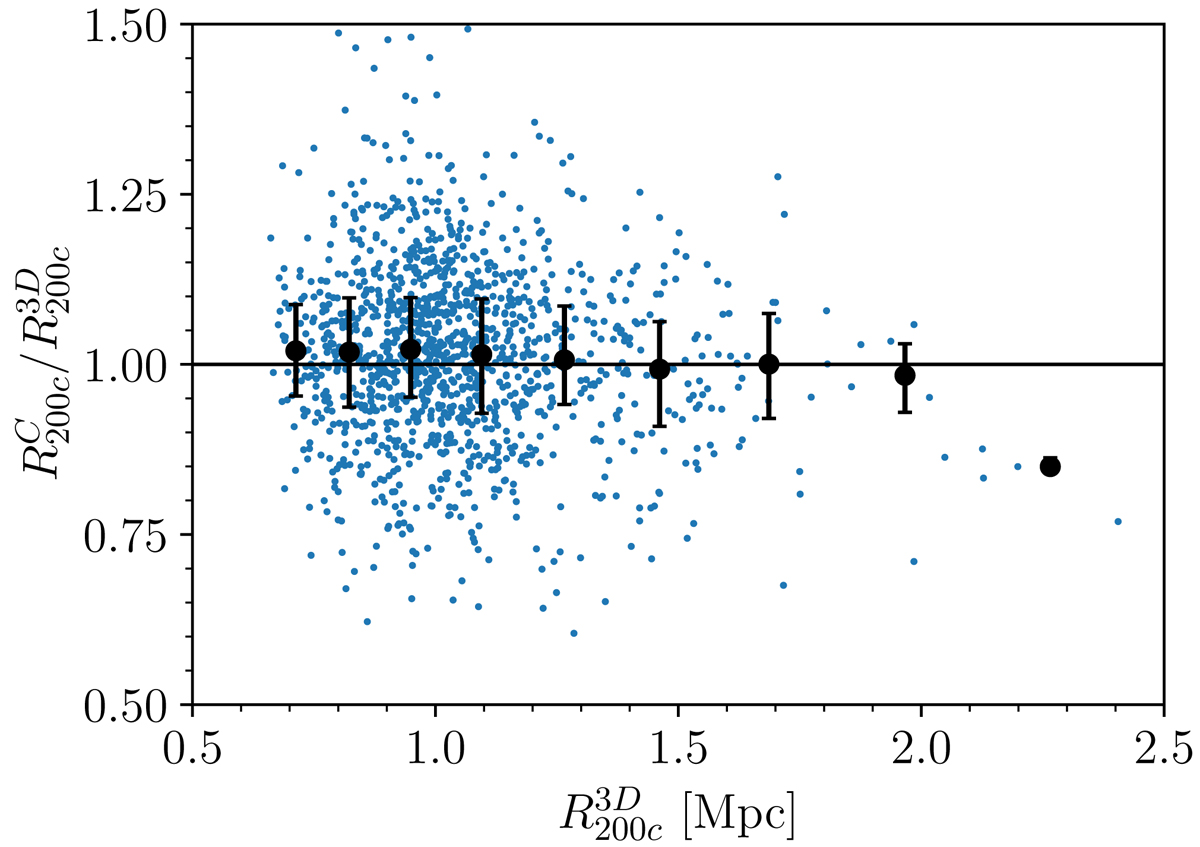
Ratios between ![]() and
and ![]() as a function of
as a function of ![]() for the simulated clusters. We omit 12 clusters with a ratio > 1.5 for clarity. Points with error bars show the median and interquartile range of all the ratios in nine logarithmic bins of
for the simulated clusters. We omit 12 clusters with a ratio > 1.5 for clarity. Points with error bars show the median and interquartile range of all the ratios in nine logarithmic bins of ![]() . The horizontal line shows
. The horizontal line shows ![]() .
.
Current usage metrics show cumulative count of Article Views (full-text article views including HTML views, PDF and ePub downloads, according to the available data) and Abstracts Views on Vision4Press platform.
Data correspond to usage on the plateform after 2015. The current usage metrics is available 48-96 hours after online publication and is updated daily on week days.
Initial download of the metrics may take a while.