Fig. 9.
Download original image
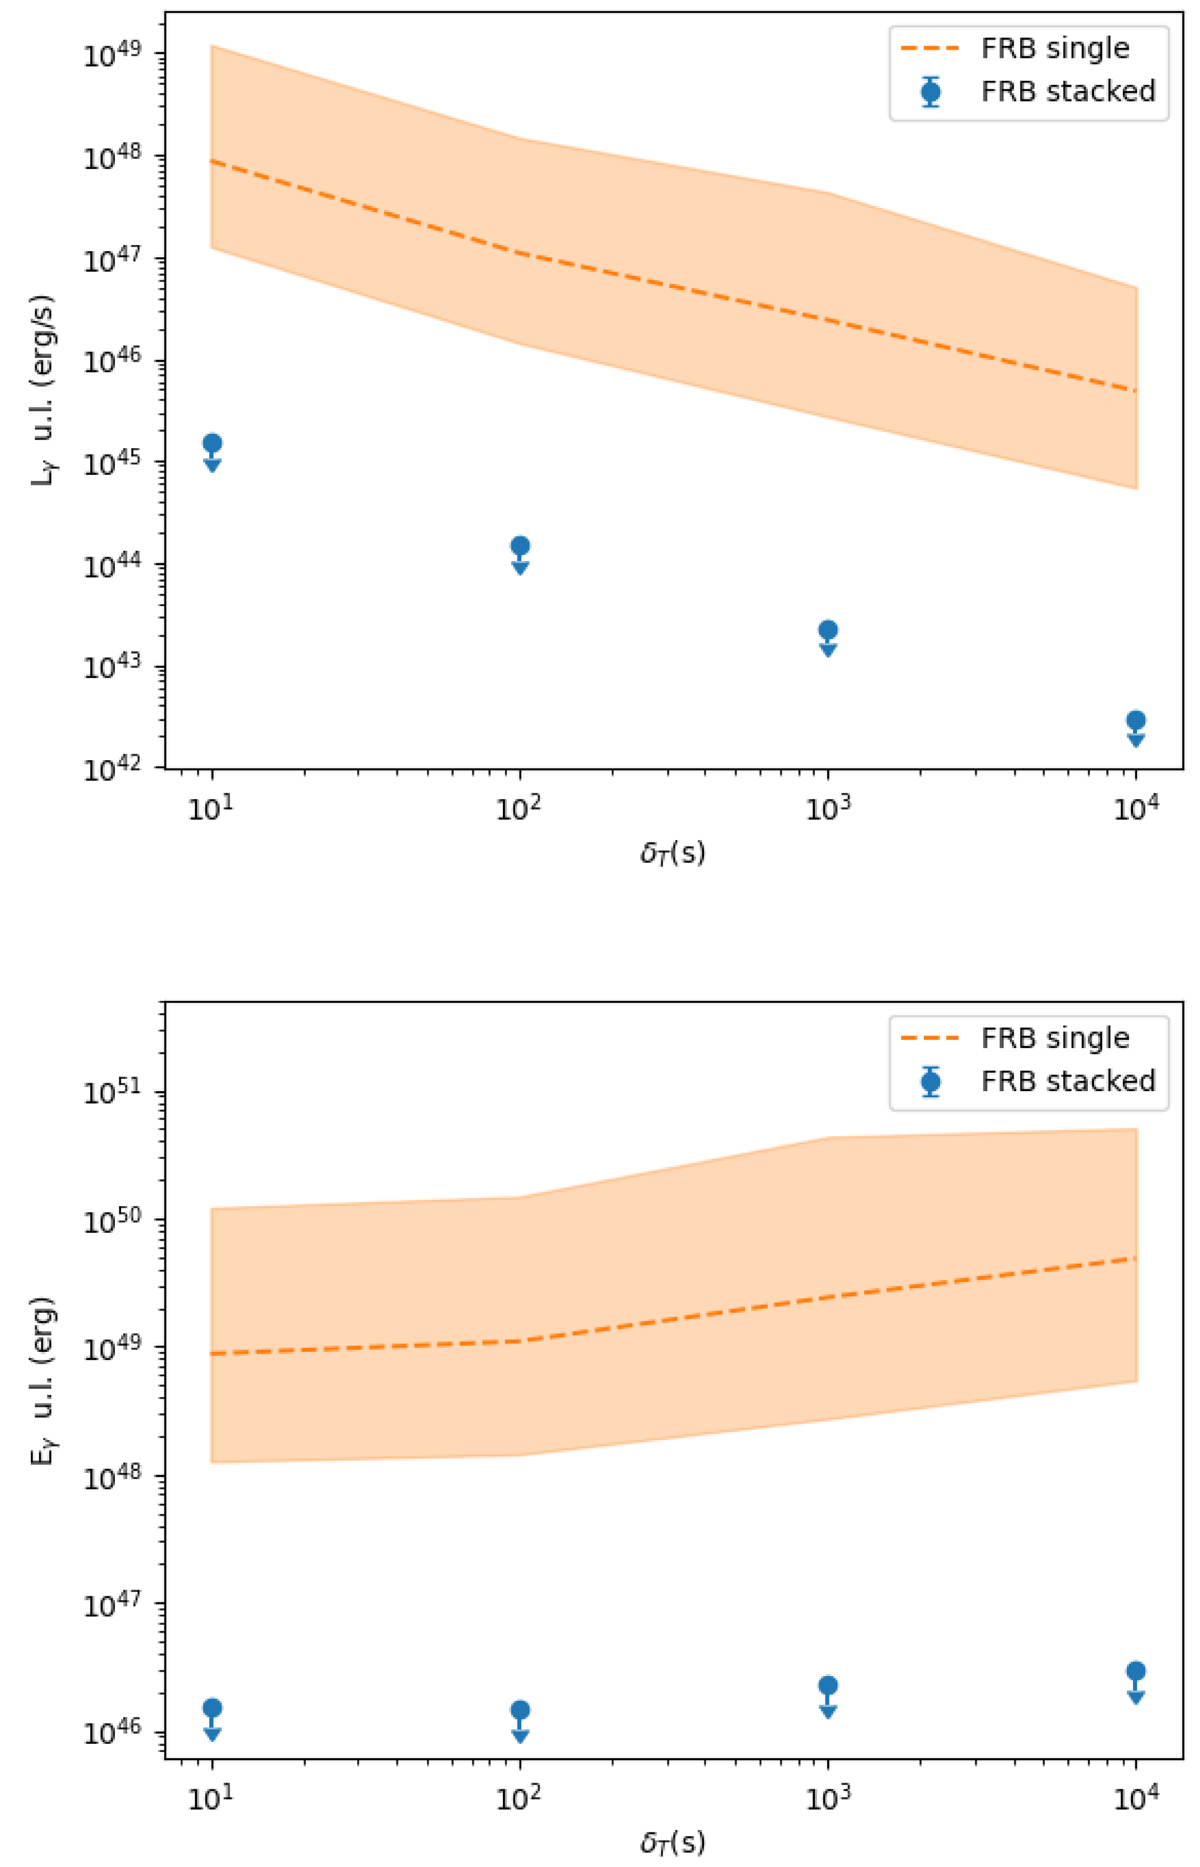
Upper limits at 95% CL on the gamma-ray luminosity (top) and energy (bottom) as a function of the observed time window. The ULs have been obtained for the 0.1–1000 GeV energy range. In both plots, the orange line represents the median value of upper limits obtained from individual FRB events, while the orange band is obtained from the 10% and 90% quantiles of these values. Blue arrows represent the upper limits from the stacking analysis on all bursts.
Current usage metrics show cumulative count of Article Views (full-text article views including HTML views, PDF and ePub downloads, according to the available data) and Abstracts Views on Vision4Press platform.
Data correspond to usage on the plateform after 2015. The current usage metrics is available 48-96 hours after online publication and is updated daily on week days.
Initial download of the metrics may take a while.