Fig. 8.
Download original image
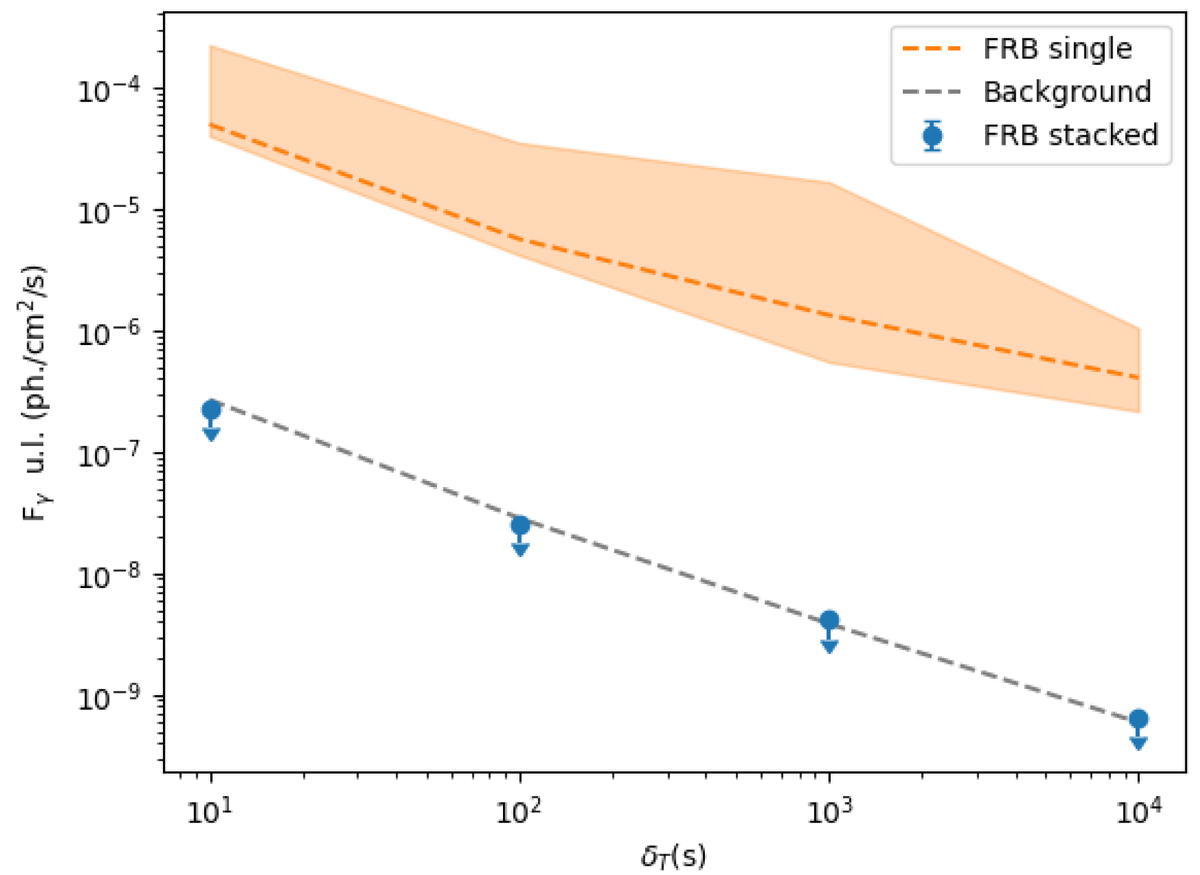
Upper limits on gamma-ray flux at 95% confidence level for time windows considered in our analysis (10, 100, 1000 and 10 000 s). The orange dashed line represents the median value of ULs on individual FRB events, while the orange band is obtained from the 10% and 90% quantiles of these values, while the blue points are the ULs obtained with the stacking analysis. The grey dashed line shows the upper limits derived from the stacking analysis performed on a sample of background sources.
Current usage metrics show cumulative count of Article Views (full-text article views including HTML views, PDF and ePub downloads, according to the available data) and Abstracts Views on Vision4Press platform.
Data correspond to usage on the plateform after 2015. The current usage metrics is available 48-96 hours after online publication and is updated daily on week days.
Initial download of the metrics may take a while.