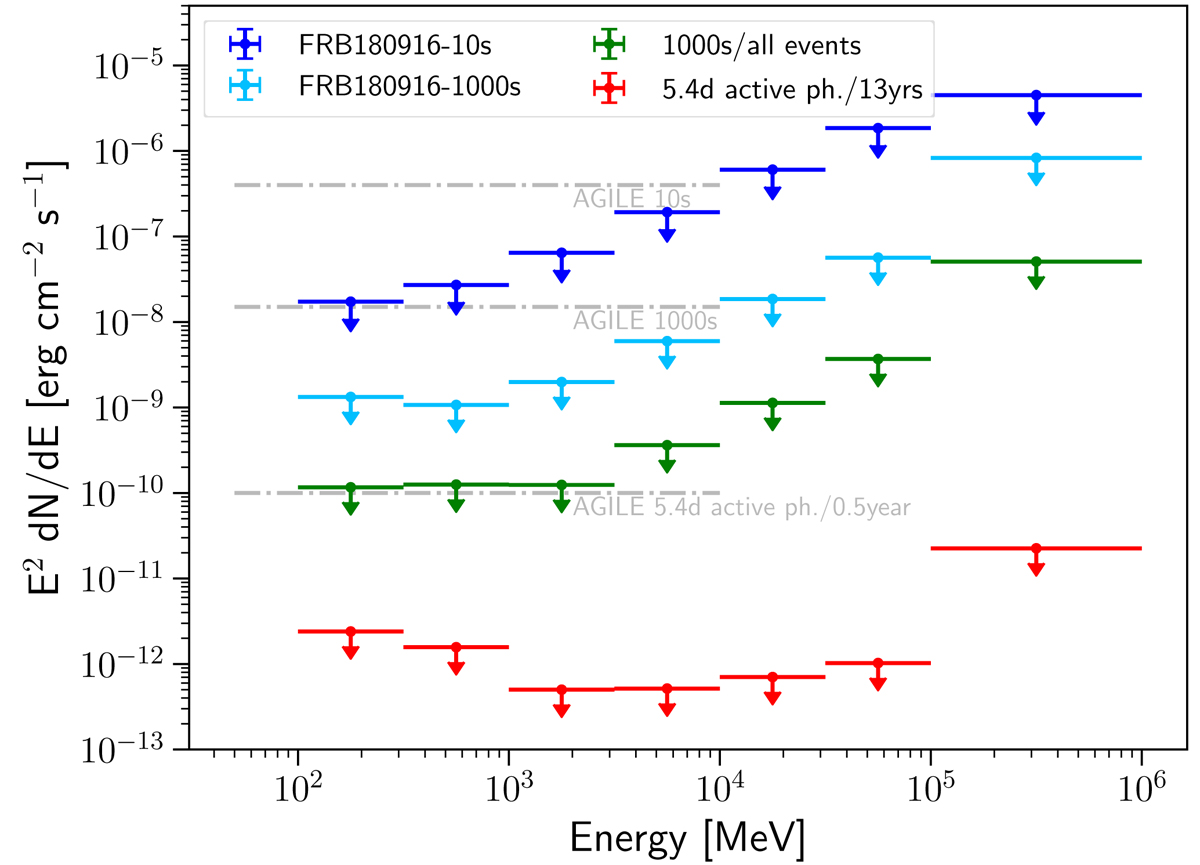
Fig. 7.
Download original image
Fermi-LAT spectrum of periodic FRB 20180916. We plot the 95% upper-limits for the 10 s and 1000 s time windows centred on the first FRB event, as well as for the folding analysis on the 72 detected bursts using 1000 s time windows and for the 5.4-day active phase windows obtained for the 13 years of LAT data. For a comparison the 2σ ULs obtained with AGILE-GRID in the 0.5–10 GeV energy band (Tavani et al. 2020) gray are plotted.
Current usage metrics show cumulative count of Article Views (full-text article views including HTML views, PDF and ePub downloads, according to the available data) and Abstracts Views on Vision4Press platform.
Data correspond to usage on the plateform after 2015. The current usage metrics is available 48-96 hours after online publication and is updated daily on week days.
Initial download of the metrics may take a while.