Fig. 6.
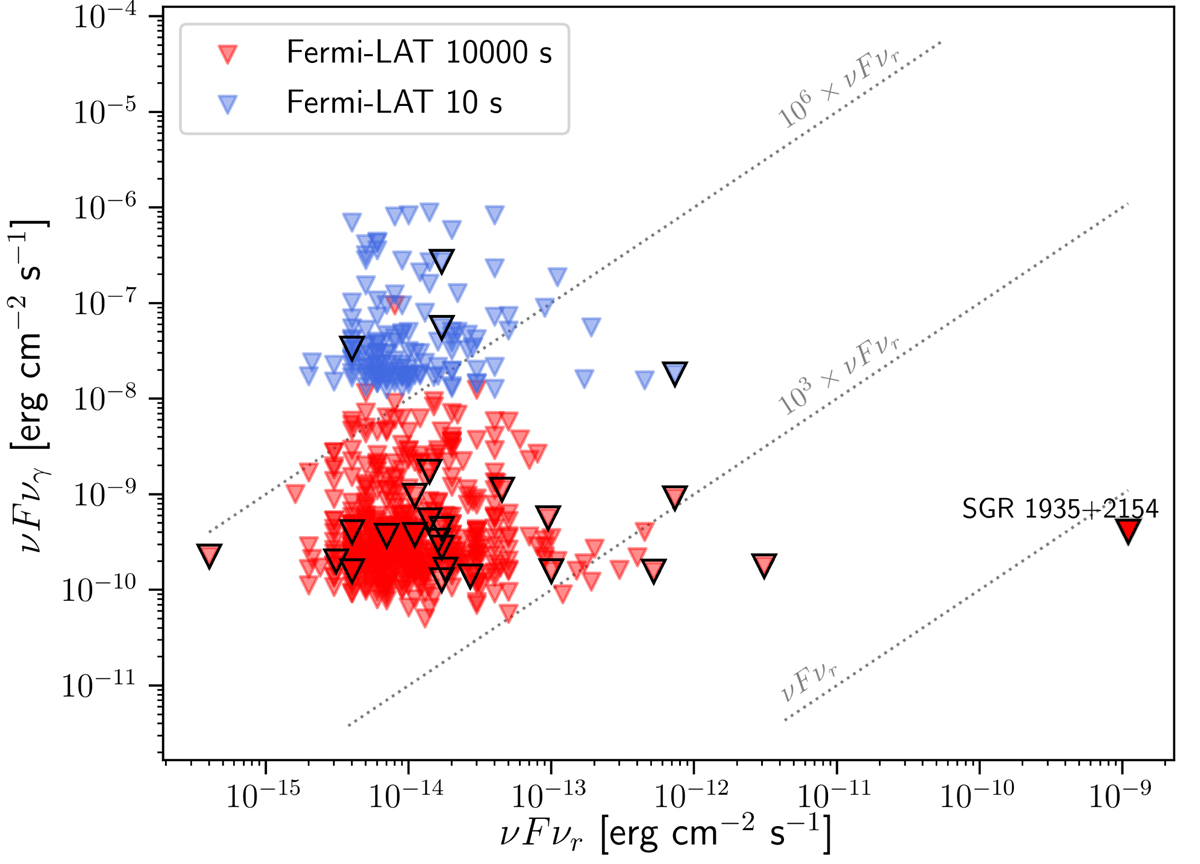
Download original image
Diagram of the upper limits on the gamma-ray energy flux as a function of radio energy fluxes (νFν). The FRB events reported are those with available information on their radio flux density and with a correctly estimated gamma-ray flux UL (i.e. sufficient gamma-ray exposure). Gamma-ray upper limits from the analysis on 10 s (10 000 s) are plotted in blue (red). To avoid further confusion we plot only the δT = 10 and 10 000 s results, the results on δT = 100 and 1000 s provide UL in between the two extreme time windows (10 and 10 000 s). FRB sources with known host-galaxy are highlighted with a black outline.
Current usage metrics show cumulative count of Article Views (full-text article views including HTML views, PDF and ePub downloads, according to the available data) and Abstracts Views on Vision4Press platform.
Data correspond to usage on the plateform after 2015. The current usage metrics is available 48-96 hours after online publication and is updated daily on week days.
Initial download of the metrics may take a while.