Open Access
Fig. 5.
Download original image
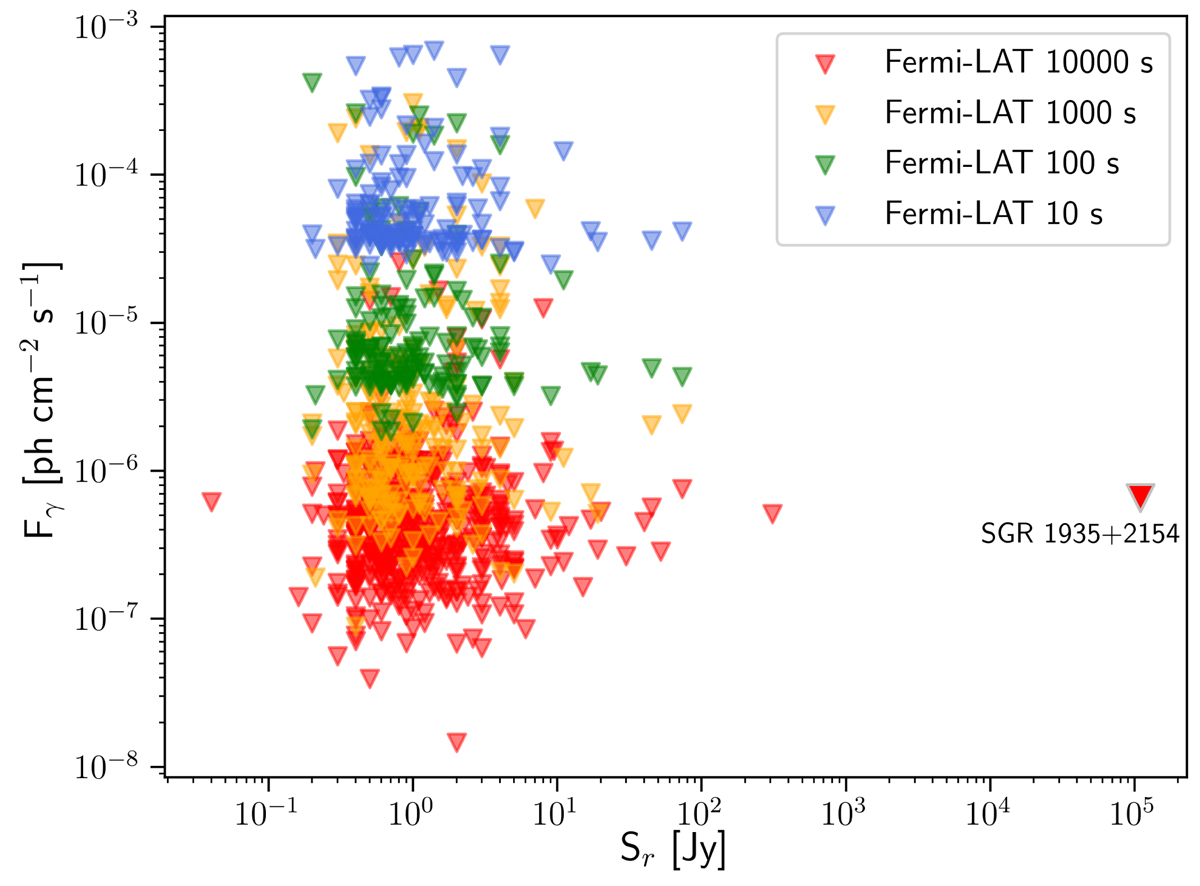
Diagram of 95% confidence level UL on the gamma-ray flux as a function of radio fluxes. The UL from the LAT analysis on δT 10–10 000 s are plotted in blue, green, orange and red, respectively.
Current usage metrics show cumulative count of Article Views (full-text article views including HTML views, PDF and ePub downloads, according to the available data) and Abstracts Views on Vision4Press platform.
Data correspond to usage on the plateform after 2015. The current usage metrics is available 48-96 hours after online publication and is updated daily on week days.
Initial download of the metrics may take a while.