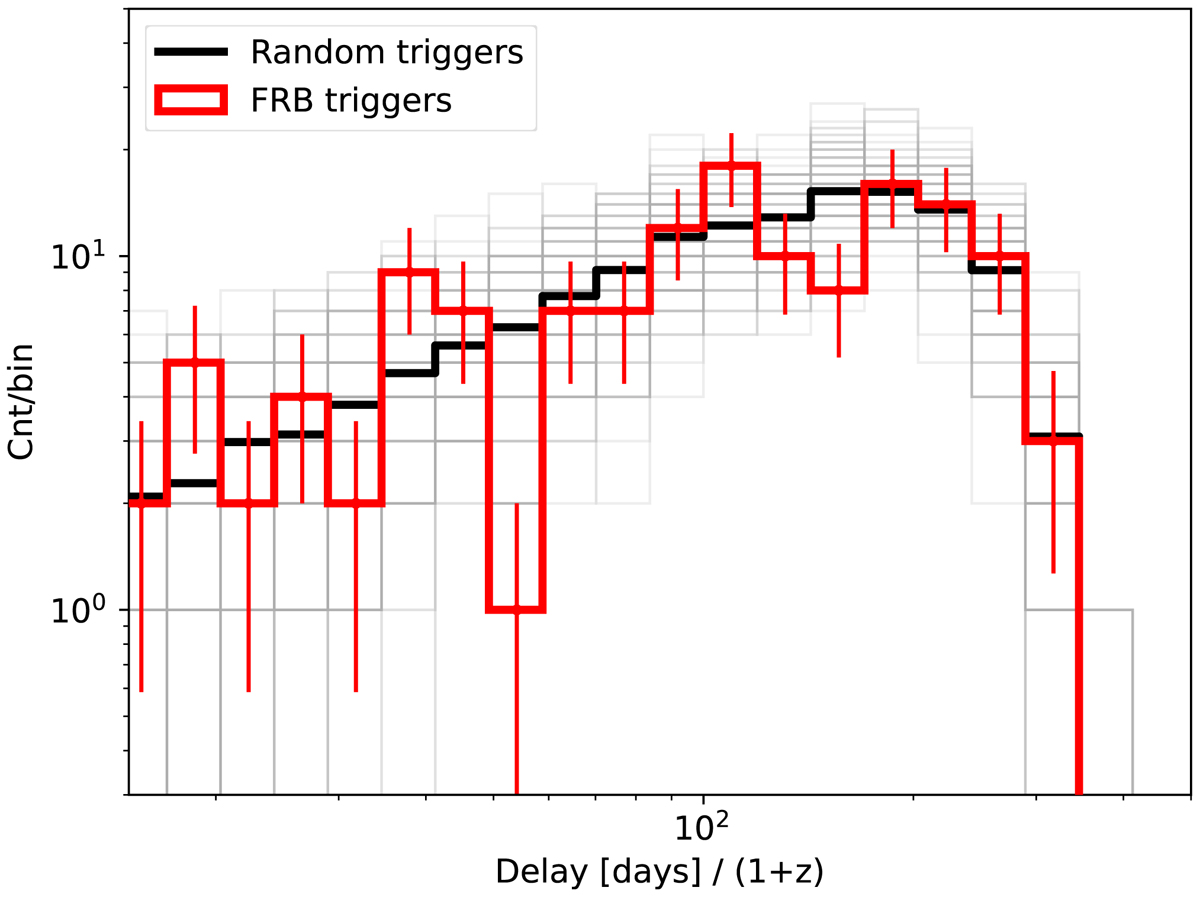
Fig. 11.
Download original image
Distribution of delay of the significant triplet with respect to trigger time of the FRB event. This distribution only includes non-repeating FRBs and is compared to 100 background distributions (grey lines) obtained by shuffling the trigger times for each FRB event. The black distribution is the mean background distribution obtained by averaging the 100 random realizations. Triplets with a delay greater than one year are not considered in this plot.
Current usage metrics show cumulative count of Article Views (full-text article views including HTML views, PDF and ePub downloads, according to the available data) and Abstracts Views on Vision4Press platform.
Data correspond to usage on the plateform after 2015. The current usage metrics is available 48-96 hours after online publication and is updated daily on week days.
Initial download of the metrics may take a while.