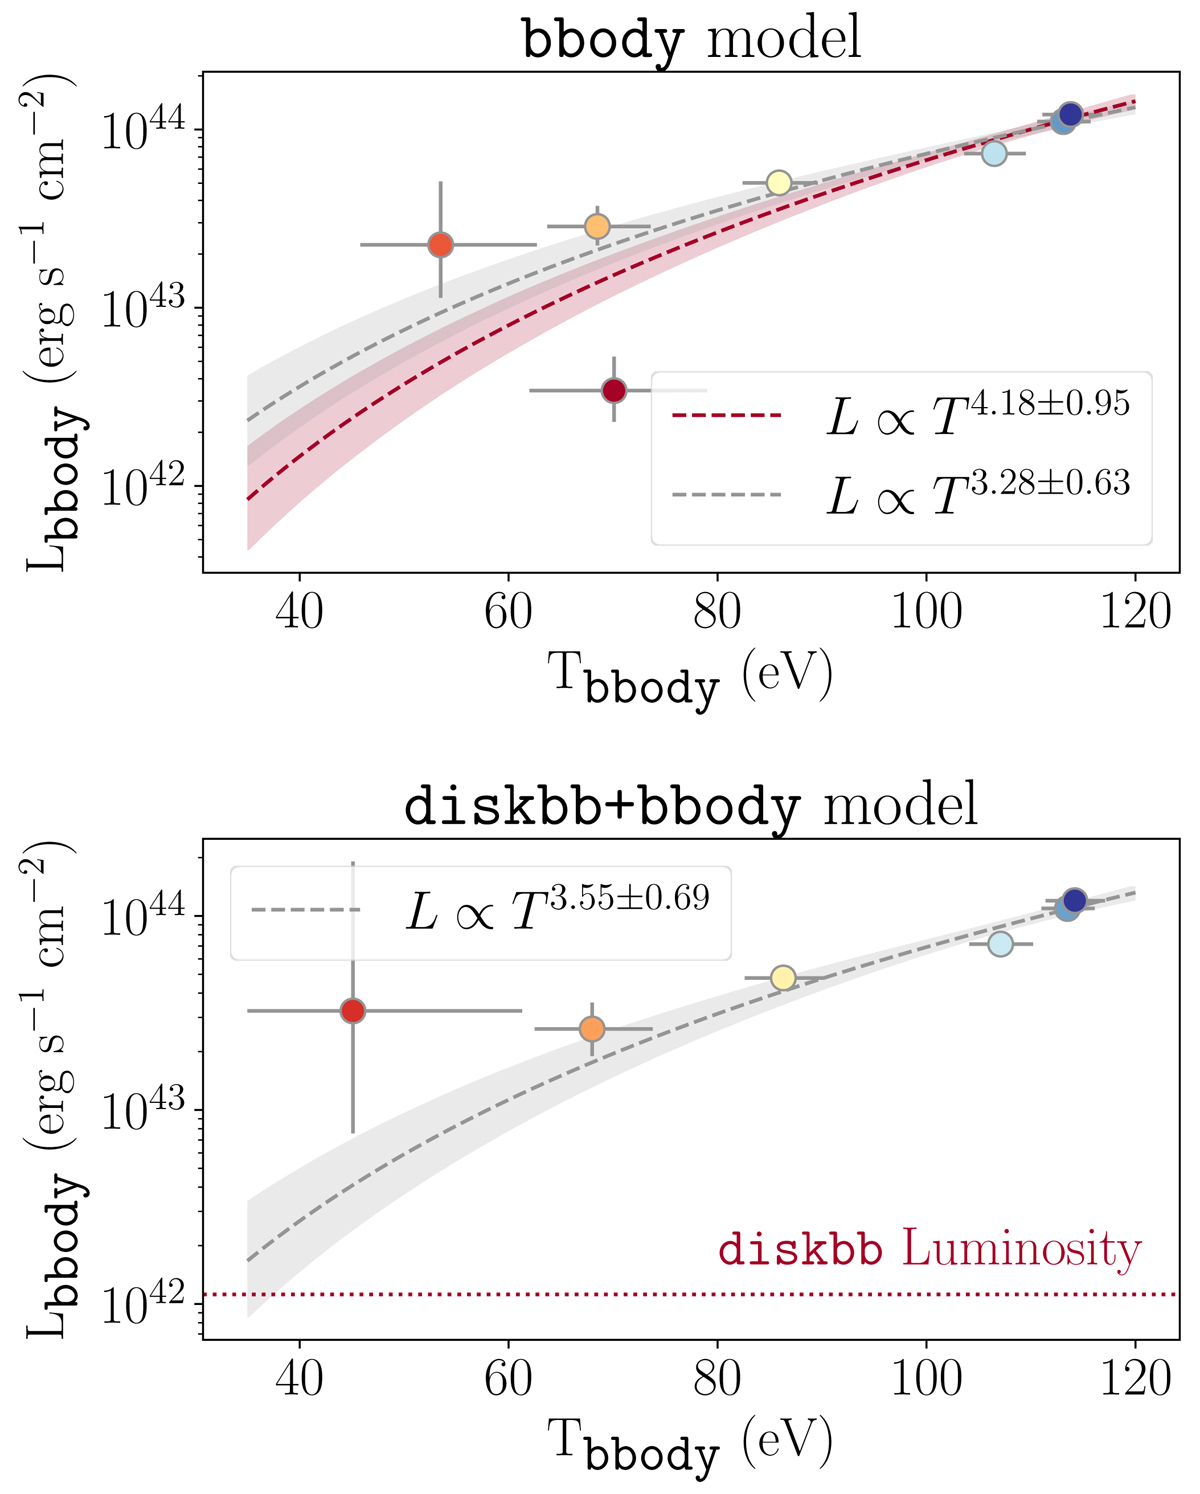
Fig. 8.

Download original image
Evolution during the XMM-Newton observation of the bolometric bbody luminosity compared to the temperature in both spectral models, fitted with a power law. The colours are used to identify individual time windows (see Fig. 7). Top panel: TBabs × zashift × bbody model. The red line corresponds to a fit using all the data points, with the quiescent state in dark red being a visible outlier. The grey line corresponds to the fit performed excluding the quiescent state. The shaded areas and the uncertainty on the power-law index correspond to a 1σ confidence level. Bottom panel: TBabs × zashift × (diskbb + bbody) model.
Current usage metrics show cumulative count of Article Views (full-text article views including HTML views, PDF and ePub downloads, according to the available data) and Abstracts Views on Vision4Press platform.
Data correspond to usage on the plateform after 2015. The current usage metrics is available 48-96 hours after online publication and is updated daily on week days.
Initial download of the metrics may take a while.


