Fig. 5.
Download original image
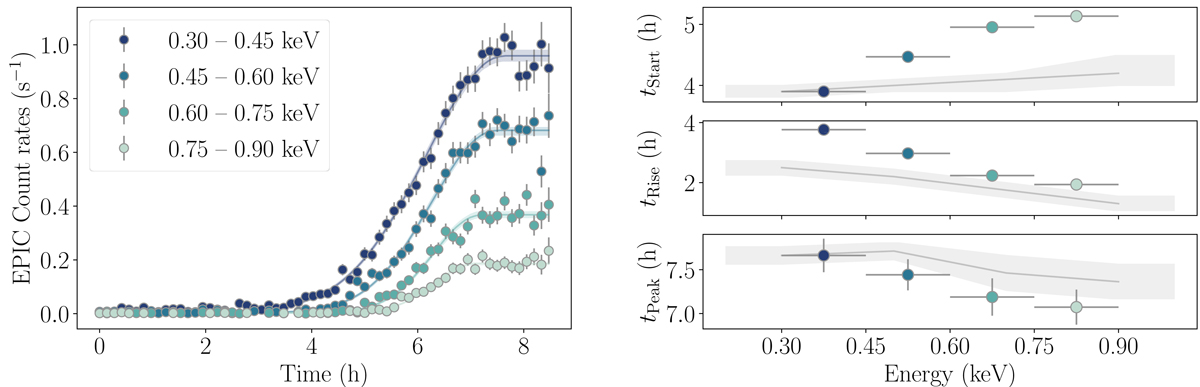
Short-term light curves and timing properties of the XMM-Newton burst of Tormund in different energy bands. Left panel: combined background-subtracted EPIC light curves in different energy bands, binned at 500 s. Each light curve was fitted with a simple model of Gaussian rise between two plateau phases. The envelopes correspond to the 16th and 84th percentiles of the posteriors generated from the fitted parameters. Right panels: energy dependence of the fitted start time, rise time, and peak time of the burst. The start and peak times are expressed with respect to the start of the observation. The grey shaded areas correspond to the same parameters for eRO-QPE1 in Arcodia et al. (2022), with an offset for tStart and tPeak to overlap the curves – it shows the similar energy-dependent behaviour between the sources (although the burst profile was exponential for eRO-QPE1).
Current usage metrics show cumulative count of Article Views (full-text article views including HTML views, PDF and ePub downloads, according to the available data) and Abstracts Views on Vision4Press platform.
Data correspond to usage on the plateform after 2015. The current usage metrics is available 48-96 hours after online publication and is updated daily on week days.
Initial download of the metrics may take a while.