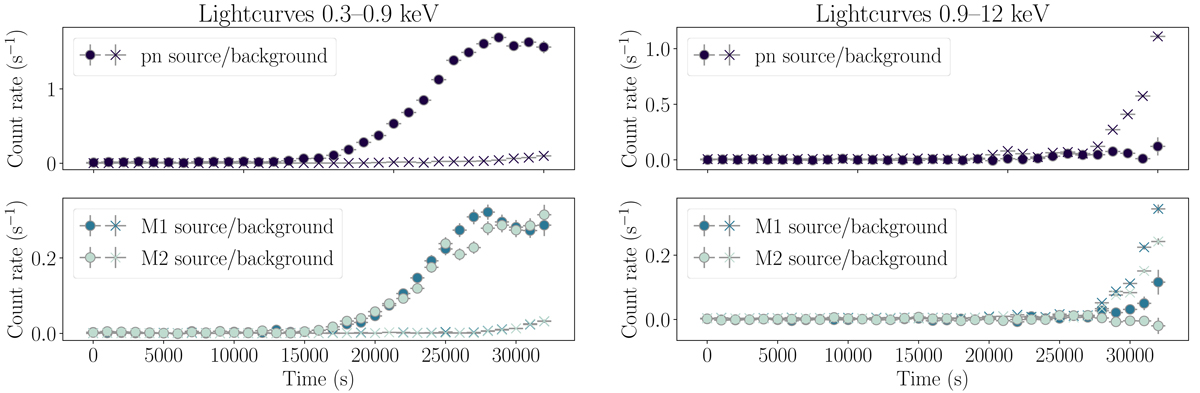
Fig. A.1.
Download original image
XMM-Newton source and background light curves of Tormund, observation 0871190301, for the three EPIC instruments and in two energy bands. The left panels correspond to energies below 0.9 keV, and the right panels to energies above 0.9 keV. The top panels show the EPIC pn light curves and the bottom panels show both the EPIC MOS1 and MOS2 light curves. The background-subtracted light curves are shown with filled circles, while the backgrounds are shown with crosses; backgrounds are scaled to the area of the source extraction region. This figure shows that a background flare is present at the end of the observation, visible in both low and especially high energies, but there is definitely an intrinsic source variability in the soft energy band, with a high signal-to-noise ratio even during the flare. The extreme softness of the source allows us to reasonably keep time windows in which the high-energy flaring background is above the recommended threshold, under the condition that we discard any data above 0.9 keV. Data below 0.3 keV are discarded to avoid calibration issues between EPIC instruments.
Current usage metrics show cumulative count of Article Views (full-text article views including HTML views, PDF and ePub downloads, according to the available data) and Abstracts Views on Vision4Press platform.
Data correspond to usage on the plateform after 2015. The current usage metrics is available 48-96 hours after online publication and is updated daily on week days.
Initial download of the metrics may take a while.