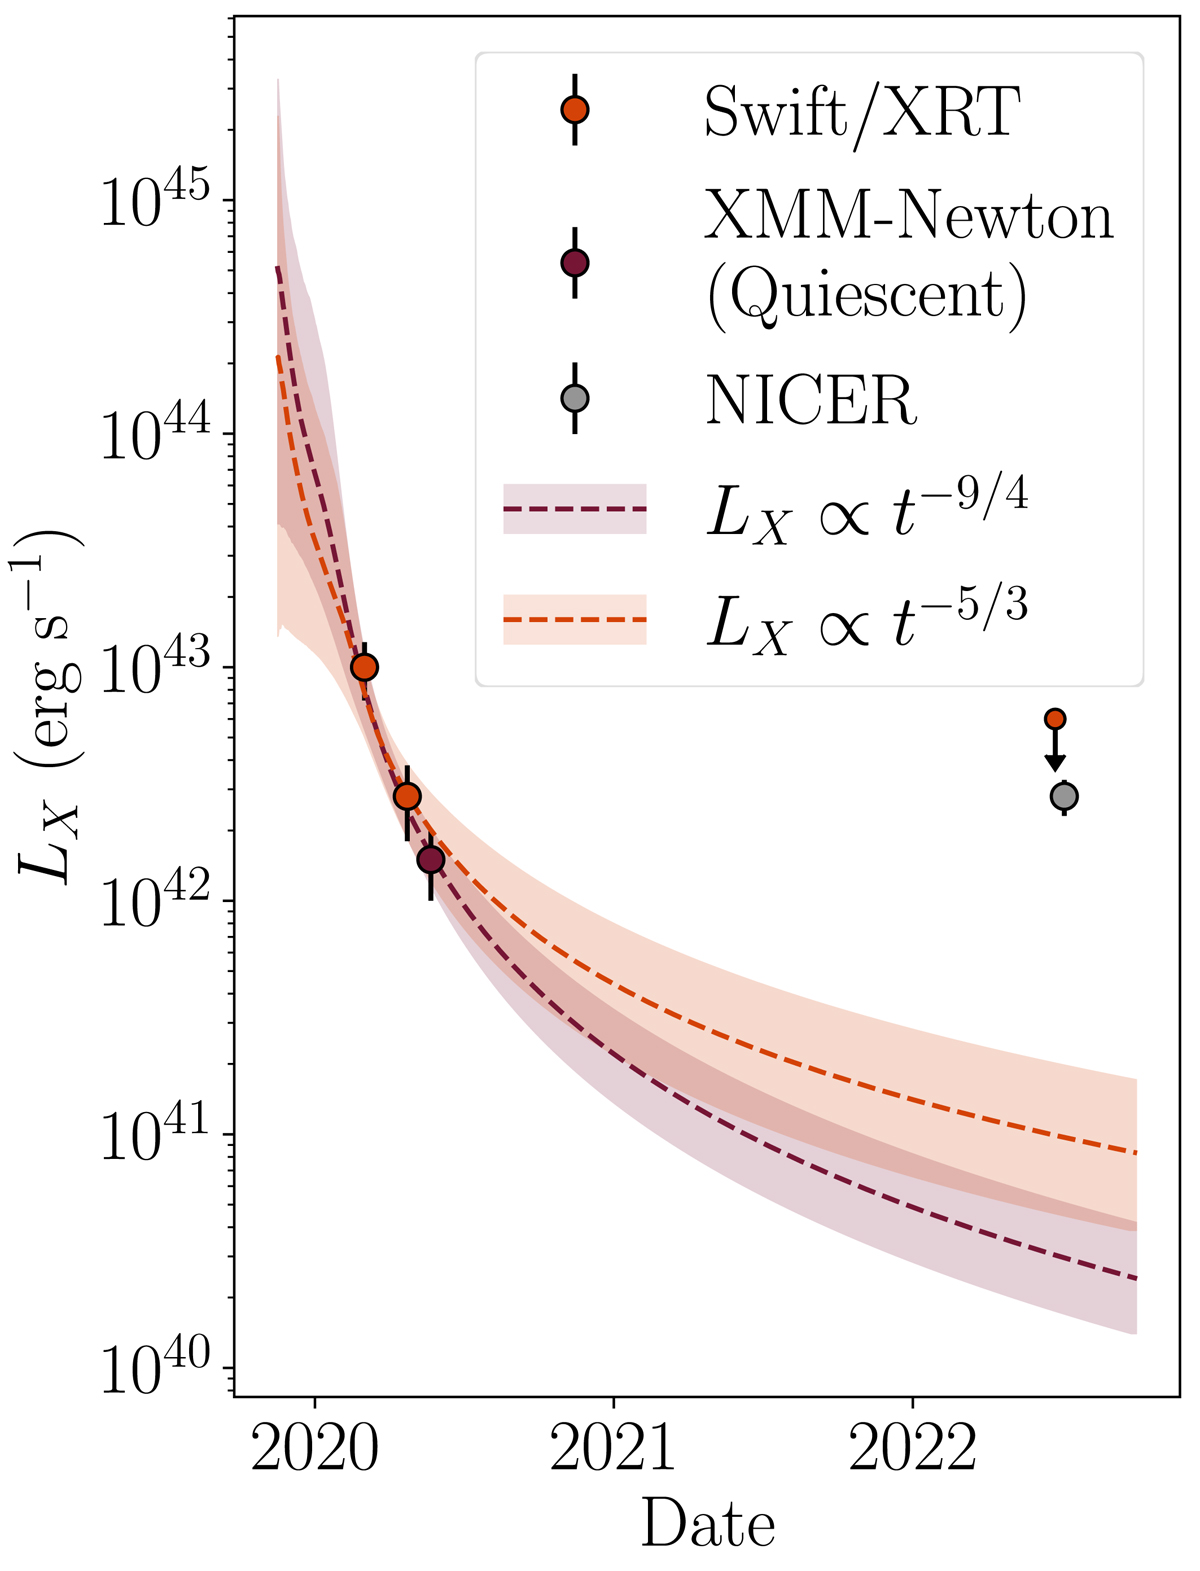
Fig. 15.
Download original image
X-ray detections and upper-limits of Tormund, with the expected behaviour of an X-ray TDE following a L ∝ t−5/3 (respectively L ∝ t−9/4) evolution in orange (respectively red) based on the first two Swift detections and the XMM-Newton quiescent state. The dotted lines and shaded areas correspond to the medians, that is the 16th and 84th percentiles of the posterior light curves (see details in Appendix A). These contours differ from those of Fig. 1 in that the XMM-Newton quiescent level was also added as data for the light-curve fitting, allowing for better constrained envelopes. We note that the outburst during the second half of the XMM-Newton observation is not shown here, as we are only interested in the evolution of the quiescent state, which is expected to behave in a TDE-like fashion. The NICER detection is in excess of the expected behaviour of the quiescent level for both power-law decay indices, hinting at a possible re-brightening.
Current usage metrics show cumulative count of Article Views (full-text article views including HTML views, PDF and ePub downloads, according to the available data) and Abstracts Views on Vision4Press platform.
Data correspond to usage on the plateform after 2015. The current usage metrics is available 48-96 hours after online publication and is updated daily on week days.
Initial download of the metrics may take a while.