Open Access
Fig. 10.
Download original image
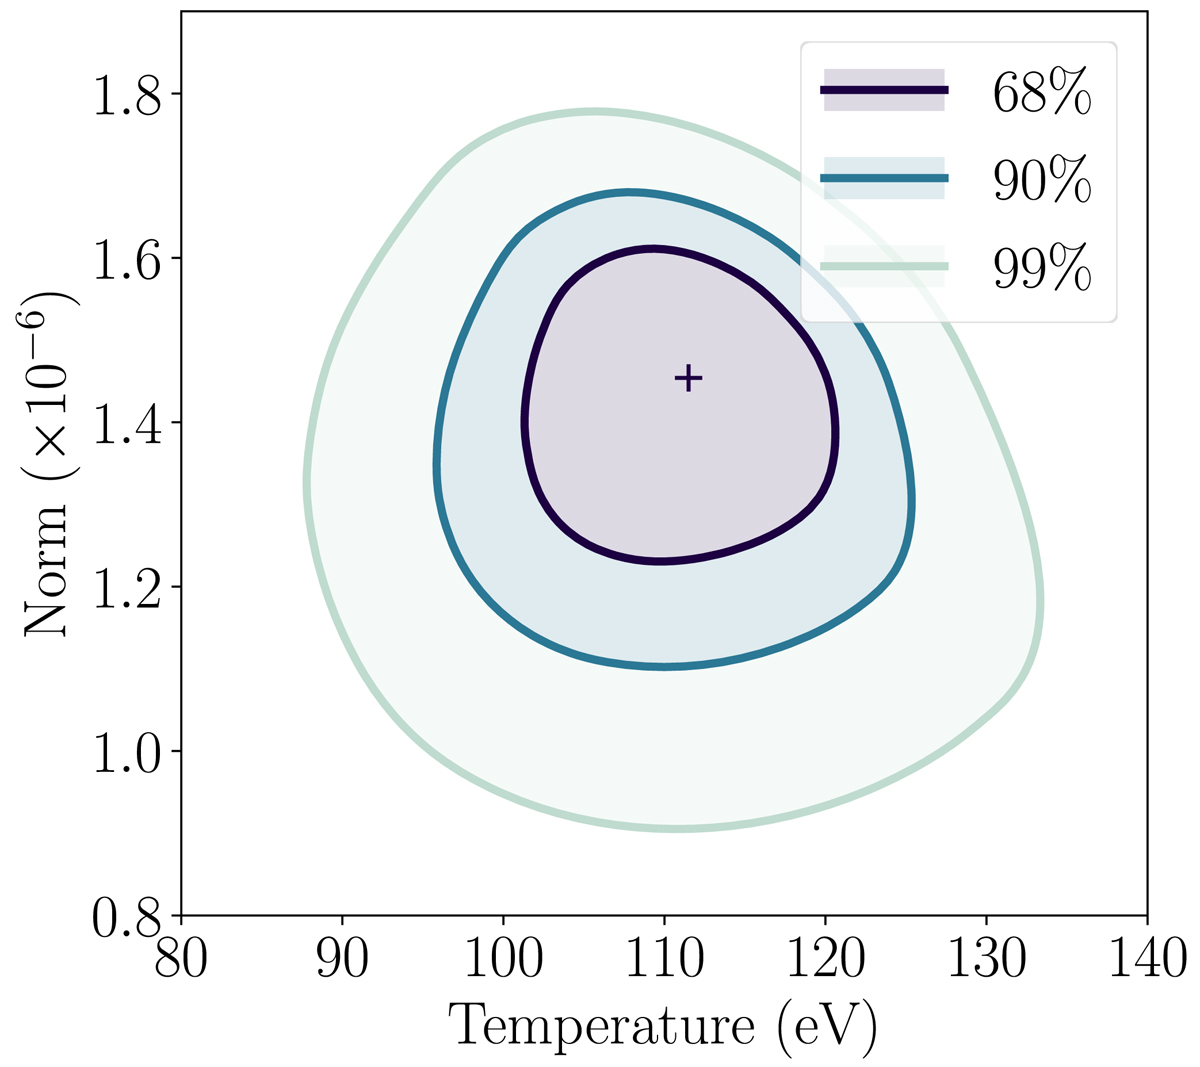
Contour plot of the spectral fit of the NICER detection. The levels correspond to the 68%, 90%, and 99% confidence intervals, based on the difference in fit statistics to the best fit (cross). For visualisation purposes, the underlying 100 × 100 grid was smoothed with a 2 × 2 Gaussian blur.
Current usage metrics show cumulative count of Article Views (full-text article views including HTML views, PDF and ePub downloads, according to the available data) and Abstracts Views on Vision4Press platform.
Data correspond to usage on the plateform after 2015. The current usage metrics is available 48-96 hours after online publication and is updated daily on week days.
Initial download of the metrics may take a while.