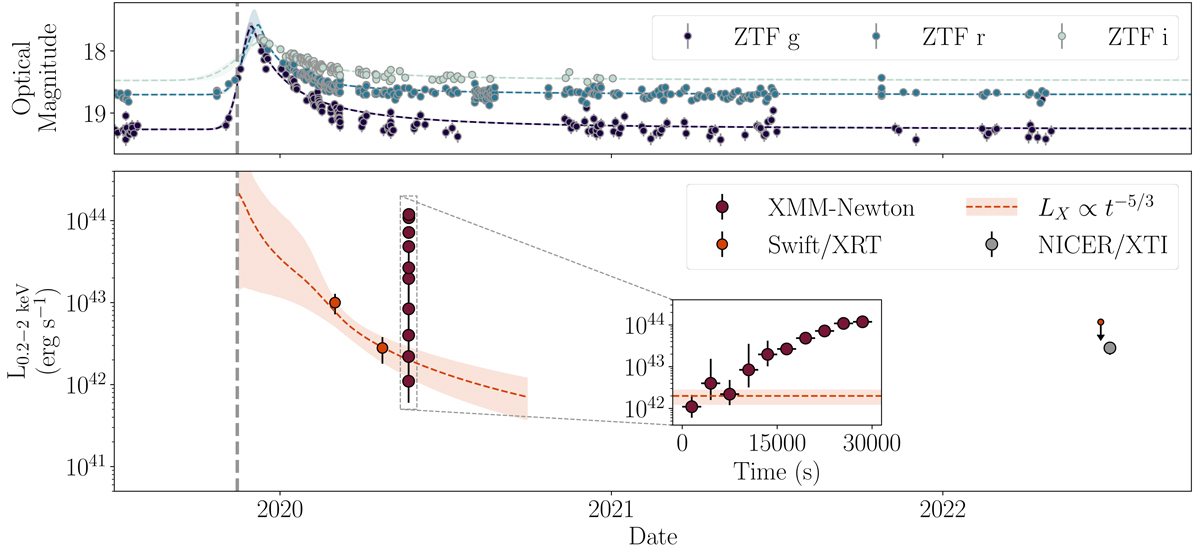
Fig. 1.
Download original image
Multi-wavelength light curves of Tormund. The vertical grey dotted line corresponds to the date of detection of the optical transient by the ZTF collaboration. Top panel: optical g, r, and i magnitudes obtained from the ZTF catalogue. The optical magnitudes are not corrected for host galaxy emission. The dotted lines and shaded areas correspond to the posterior light curves obtained from fitting a Gaussian rise and power-law decay (see details in Sect. 2). For reference, the optical spectrum of the TDE (see top panel in Fig. 3) was taken in February 2020 toward the end of the optical peak. Bottom panel: Swift, XMM-Newton, and NICER 0.2–2 keV luminosities. The orange dotted line and shaded area correspond to the estimated behaviour of an X-ray TDE decay phase following a LX ∝ t−5/3 law, as extrapolated from the two Swift data points (see Appendix A for the precise method). The inset shows the short-term variability of the XMM-Newton observation, with the quiescent state being consistent with the median value of the tail of the TDE, followed by a fast, large-amplitude burst.
Current usage metrics show cumulative count of Article Views (full-text article views including HTML views, PDF and ePub downloads, according to the available data) and Abstracts Views on Vision4Press platform.
Data correspond to usage on the plateform after 2015. The current usage metrics is available 48-96 hours after online publication and is updated daily on week days.
Initial download of the metrics may take a while.