Open Access
Fig. 5
Download original image
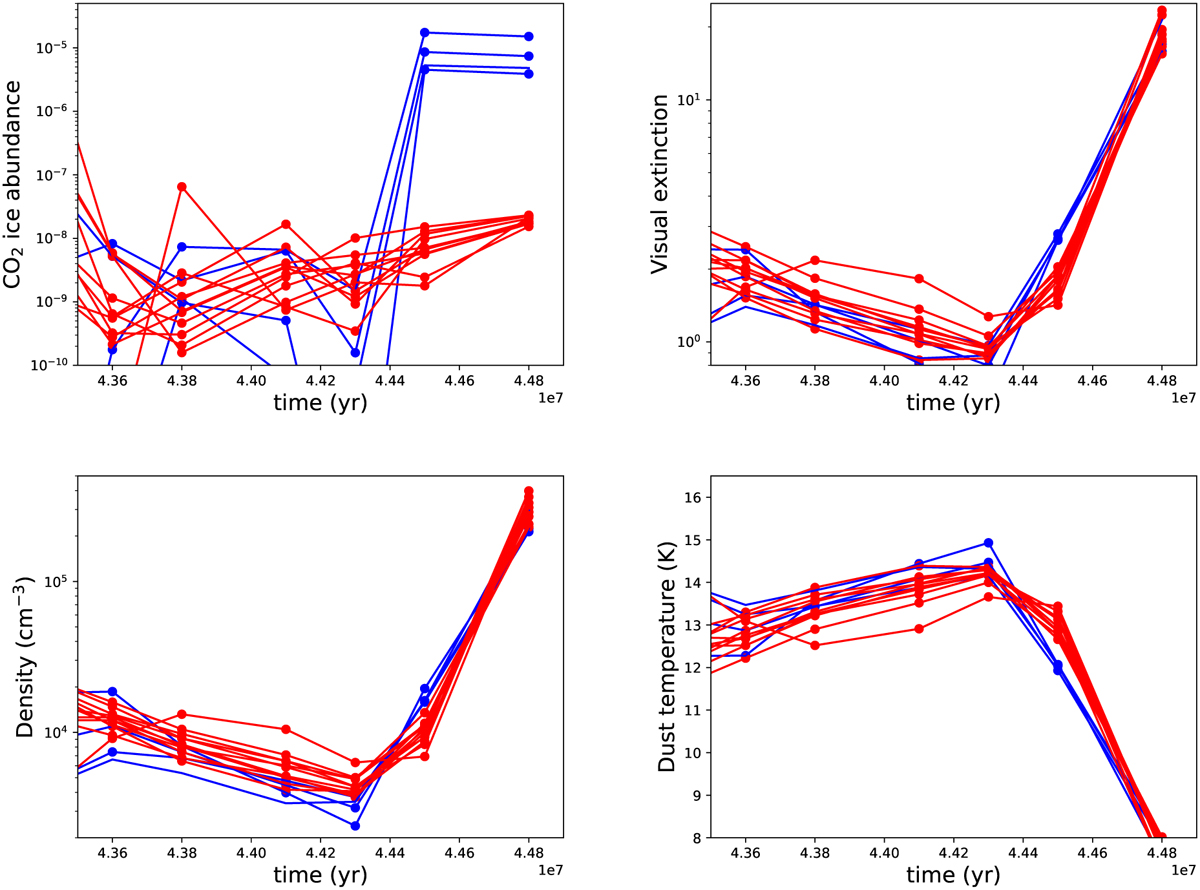
CO2 ice abundance (upper left panel), visual extinction (upper right panel), H2 density (lower left panel), and dust temperature (lower right panel) as a function of time for a few cells. The blue curves present the results for the “high CO2 column density cases” while the red ones are the “low CO2 column density cases.”
Current usage metrics show cumulative count of Article Views (full-text article views including HTML views, PDF and ePub downloads, according to the available data) and Abstracts Views on Vision4Press platform.
Data correspond to usage on the plateform after 2015. The current usage metrics is available 48-96 hours after online publication and is updated daily on week days.
Initial download of the metrics may take a while.