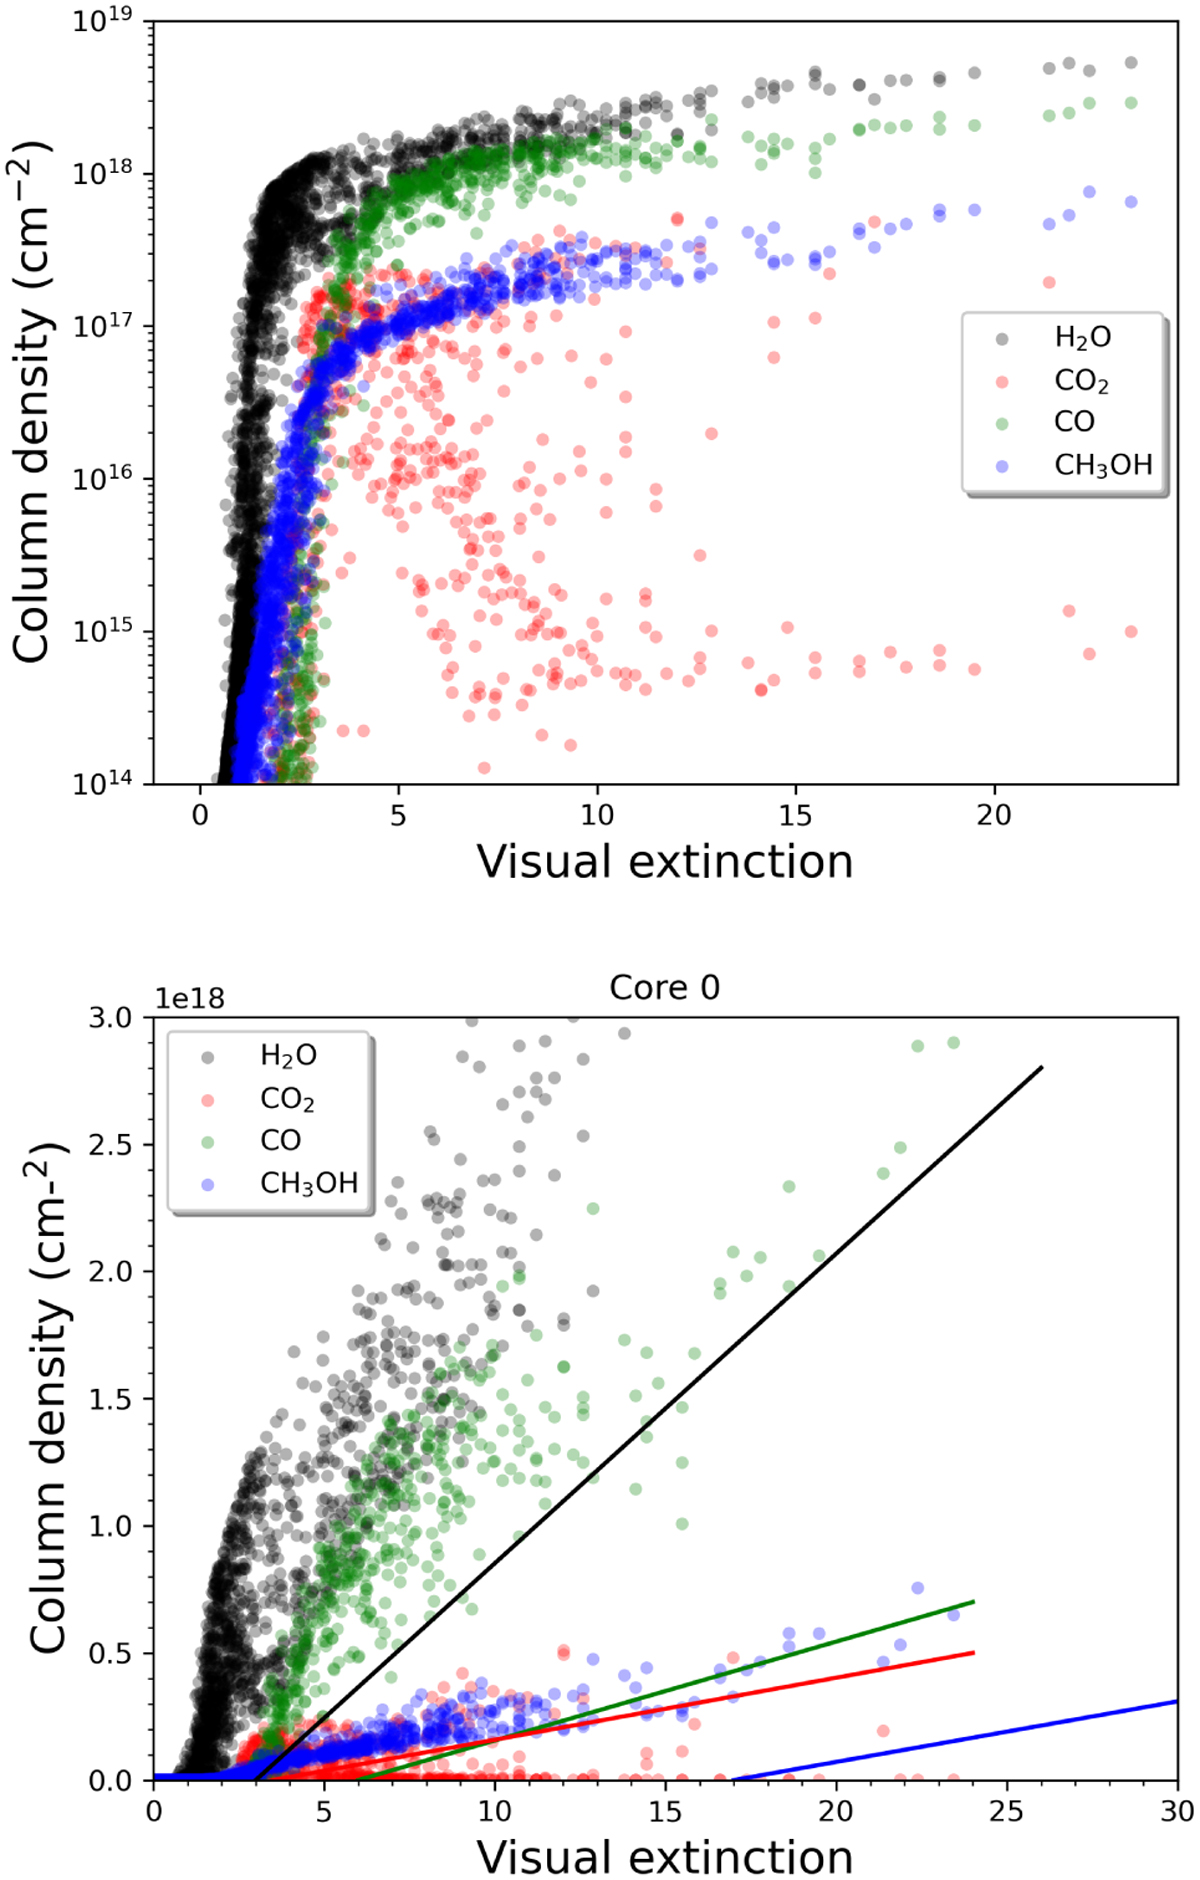
Fig. 4
Download original image
Column densities of the main ice constituents computed with the dynamical model as a function of column density for core 0, shown in the upper panel. Lower panel shows the same figure but with an axis setting similar to Fig. 7 of Boogert et al. (2015). The straight lines are the observed linear relations found by Boogert et al. (2015).
Current usage metrics show cumulative count of Article Views (full-text article views including HTML views, PDF and ePub downloads, according to the available data) and Abstracts Views on Vision4Press platform.
Data correspond to usage on the plateform after 2015. The current usage metrics is available 48-96 hours after online publication and is updated daily on week days.
Initial download of the metrics may take a while.