Open Access
Fig. 10
Download original image
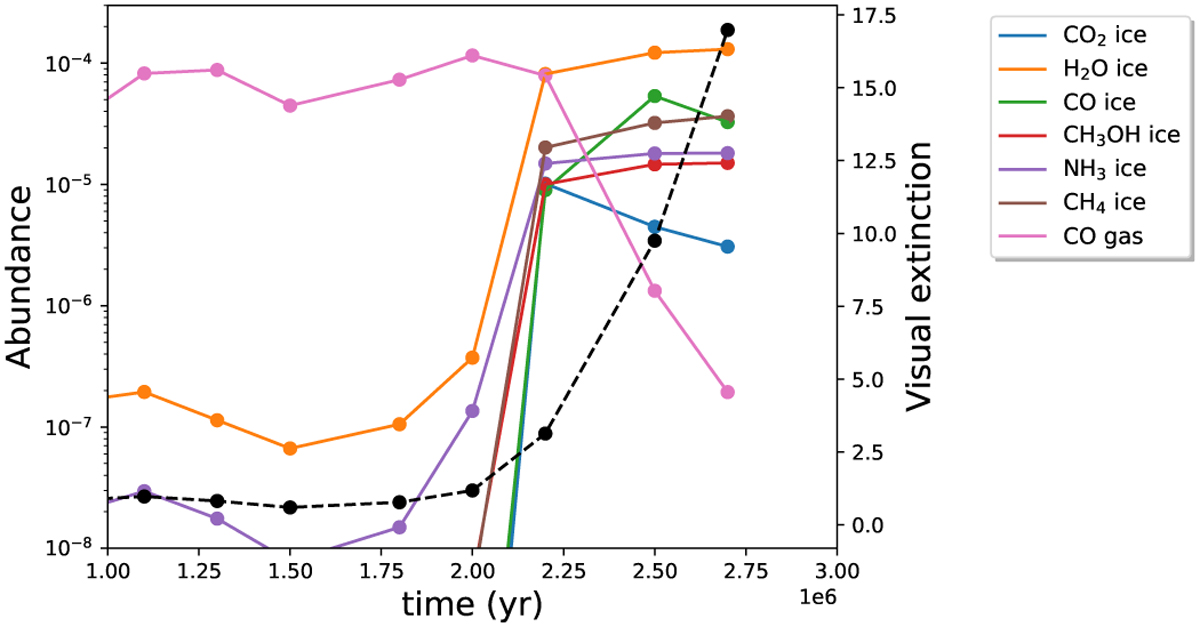
Abundances (with respect to H) of the main ice constituents and gas-phase CO as a function of time. The model is core 2, cell 8 (a trajectory that produced large amounts of CO2 ices). The visual extinction for this simulation is shown in black (dotted line).
Current usage metrics show cumulative count of Article Views (full-text article views including HTML views, PDF and ePub downloads, according to the available data) and Abstracts Views on Vision4Press platform.
Data correspond to usage on the plateform after 2015. The current usage metrics is available 48-96 hours after online publication and is updated daily on week days.
Initial download of the metrics may take a while.