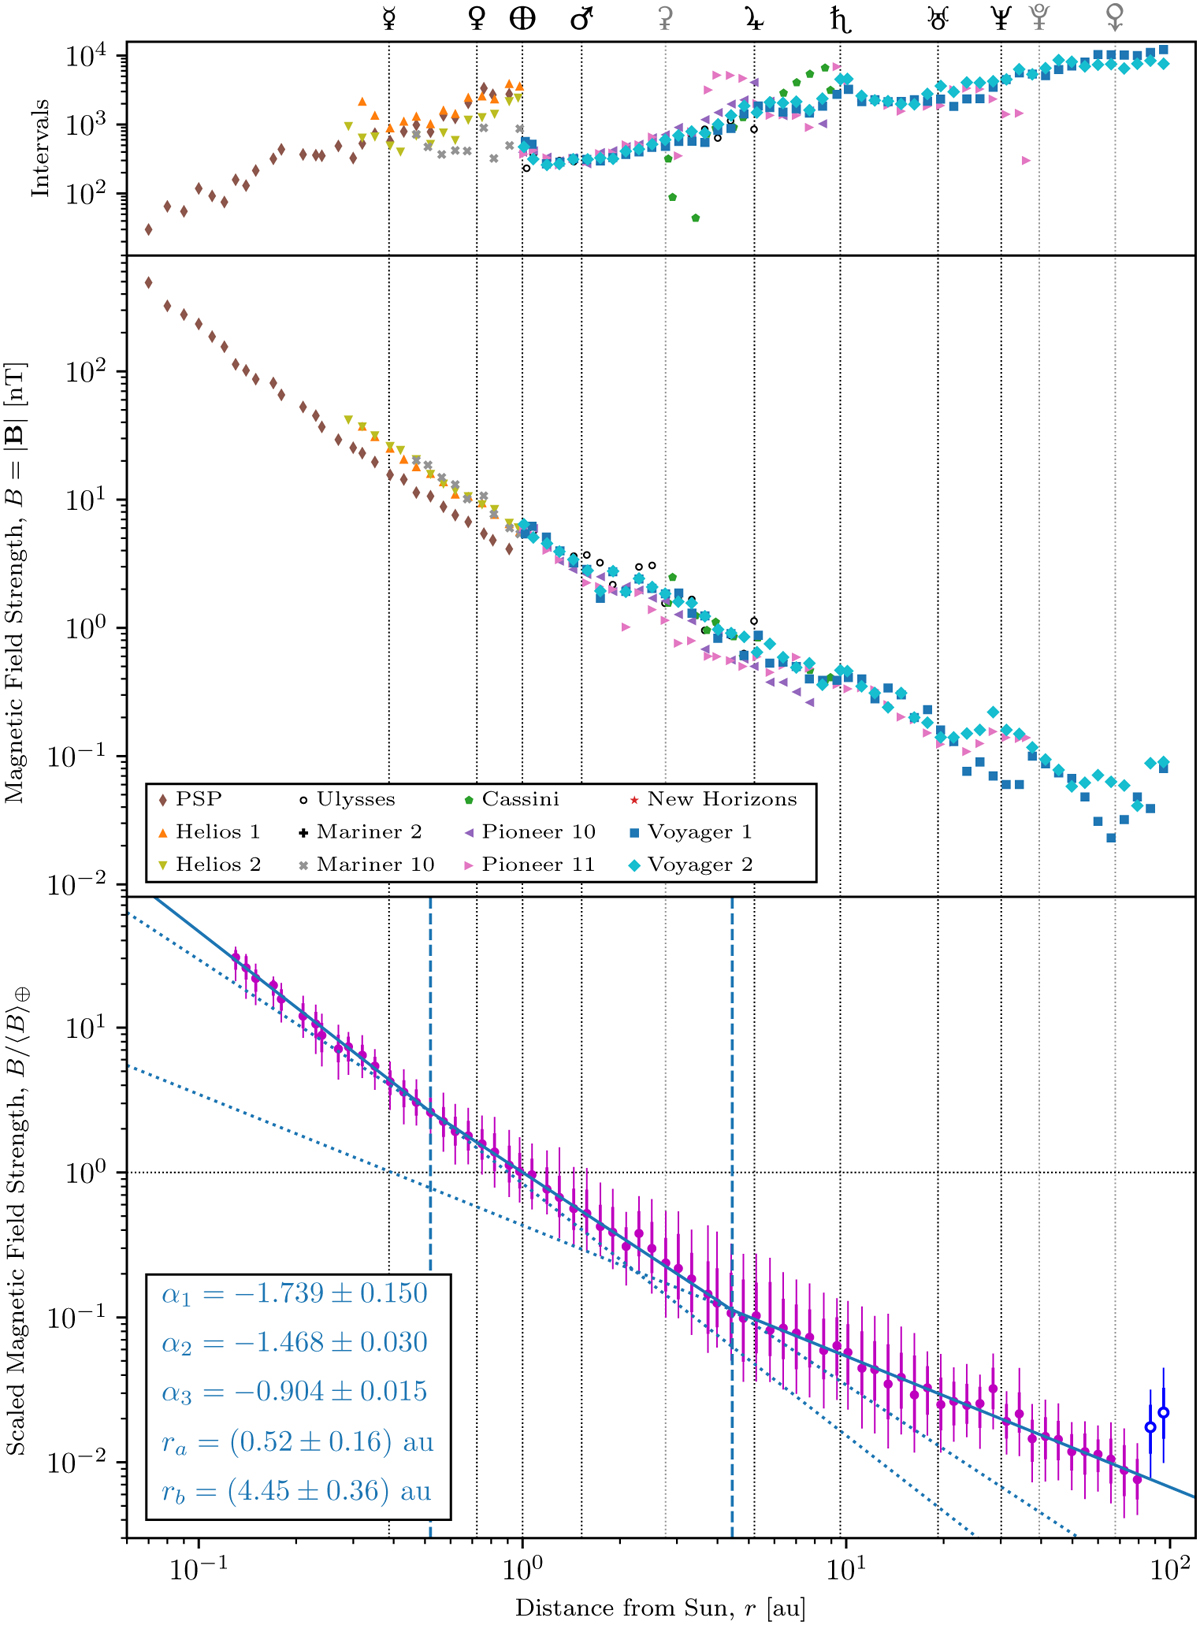
Fig. 1

Download original image
Multi-spacecraft radial trend analysis (plots versus distance, r, from the Sun) of magnetic field strength, B = |B|. Vertical lines indicate the semi-major axes of the orbits of the eight planets (black) and three dwarf planets (gray): Ceres, Pluto, and Eris. The top plot shows the number of one-hour intervals (Sect. 2) for which each spacecraft measured B. The middle plot shows each spacecraft's median B value for each r bin with at least 25 measurements. The bottom plot shows the trend in the scaled magnetic field strength, B/⟨B⟩⊕. Circular markers indicate median values, and vertical lines indicate the 25th- to 75th-percentile ranges (thick) and the 10th- to 90th-percentile ranges (thin). Bins at r > 80 au have blue markers to indicate that they are outliers due to the effects of the termination shock. The best-fit curve (Eq. (8)) is plotted in solid cyan; dashed cyan lines indicate the break points, and dotted cyan lines extend each power-law segment beyond its specified domain.
Current usage metrics show cumulative count of Article Views (full-text article views including HTML views, PDF and ePub downloads, according to the available data) and Abstracts Views on Vision4Press platform.
Data correspond to usage on the plateform after 2015. The current usage metrics is available 48-96 hours after online publication and is updated daily on week days.
Initial download of the metrics may take a while.


