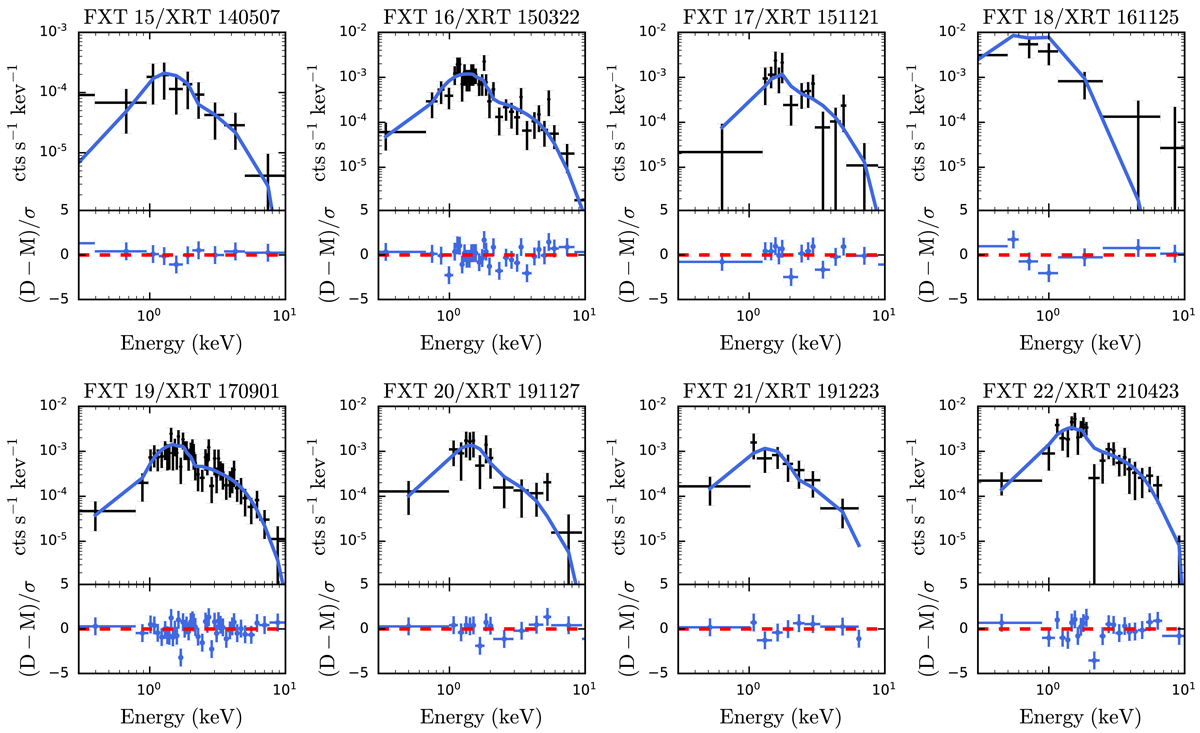
Fig. 9.
Download original image
X-ray spectra per FXT candidates. Top panels: X-ray spectra (black crosses), in units of counts s−1 keV−1. We also plot the best-fit absorbed power-law (blue lines) spectral model; see Table 7 for the corresponding best-fitting parameters. Bottom panels: residuals (defined as data-model normalized by the uncertainty) of each spectral model.
Current usage metrics show cumulative count of Article Views (full-text article views including HTML views, PDF and ePub downloads, according to the available data) and Abstracts Views on Vision4Press platform.
Data correspond to usage on the plateform after 2015. The current usage metrics is available 48-96 hours after online publication and is updated daily on week days.
Initial download of the metrics may take a while.