Fig. 8.
Download original image
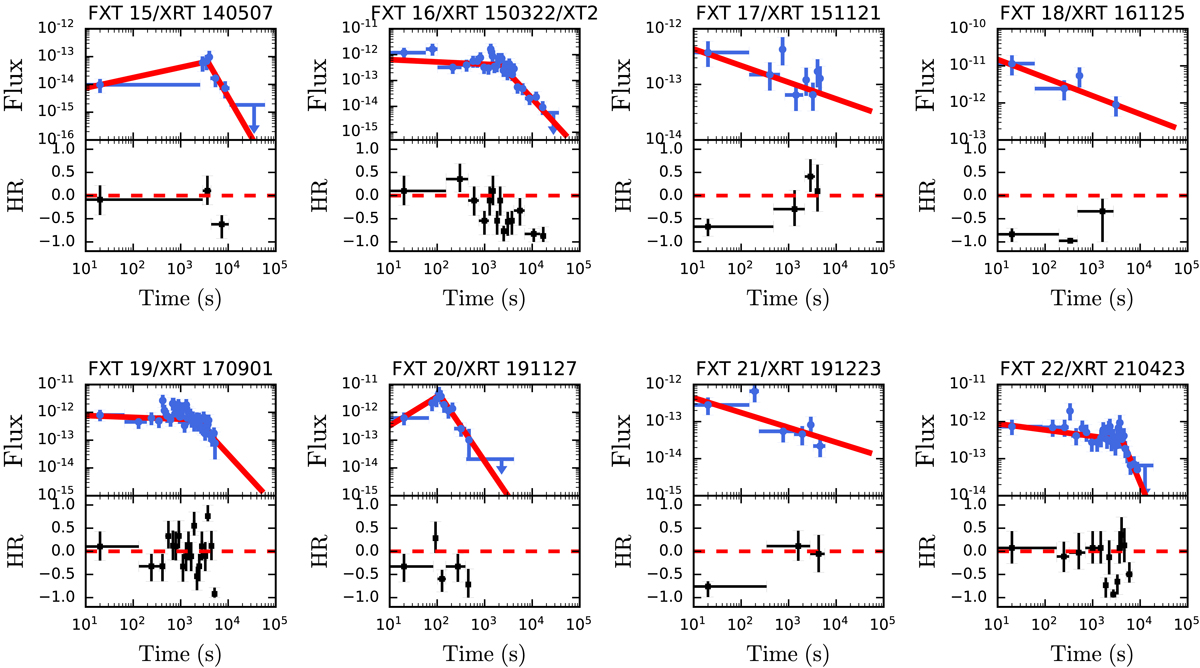
Light curve and hardness evolution. Top panels: observed 0.5–7.0 keV X-ray light curves in cgs units (blue points), starting at T = 20 s. We also plot the best-fit broken power-law or simple power-law model (red solid lines). The light curves contain five counts per bin. Bottom panels: hardness ratio evolution (the soft and hard energy bands are 0.5–2.0 keV and 2.0–7.0 keV, respectively), following the Bayesian method of Park et al. (2006). The red dashed line denotes a hardness ratio equal to zero. Here, T0 = 0 s is defined as the time when the count rate is 3σ higher than the Poisson background level.
Current usage metrics show cumulative count of Article Views (full-text article views including HTML views, PDF and ePub downloads, according to the available data) and Abstracts Views on Vision4Press platform.
Data correspond to usage on the plateform after 2015. The current usage metrics is available 48-96 hours after online publication and is updated daily on week days.
Initial download of the metrics may take a while.