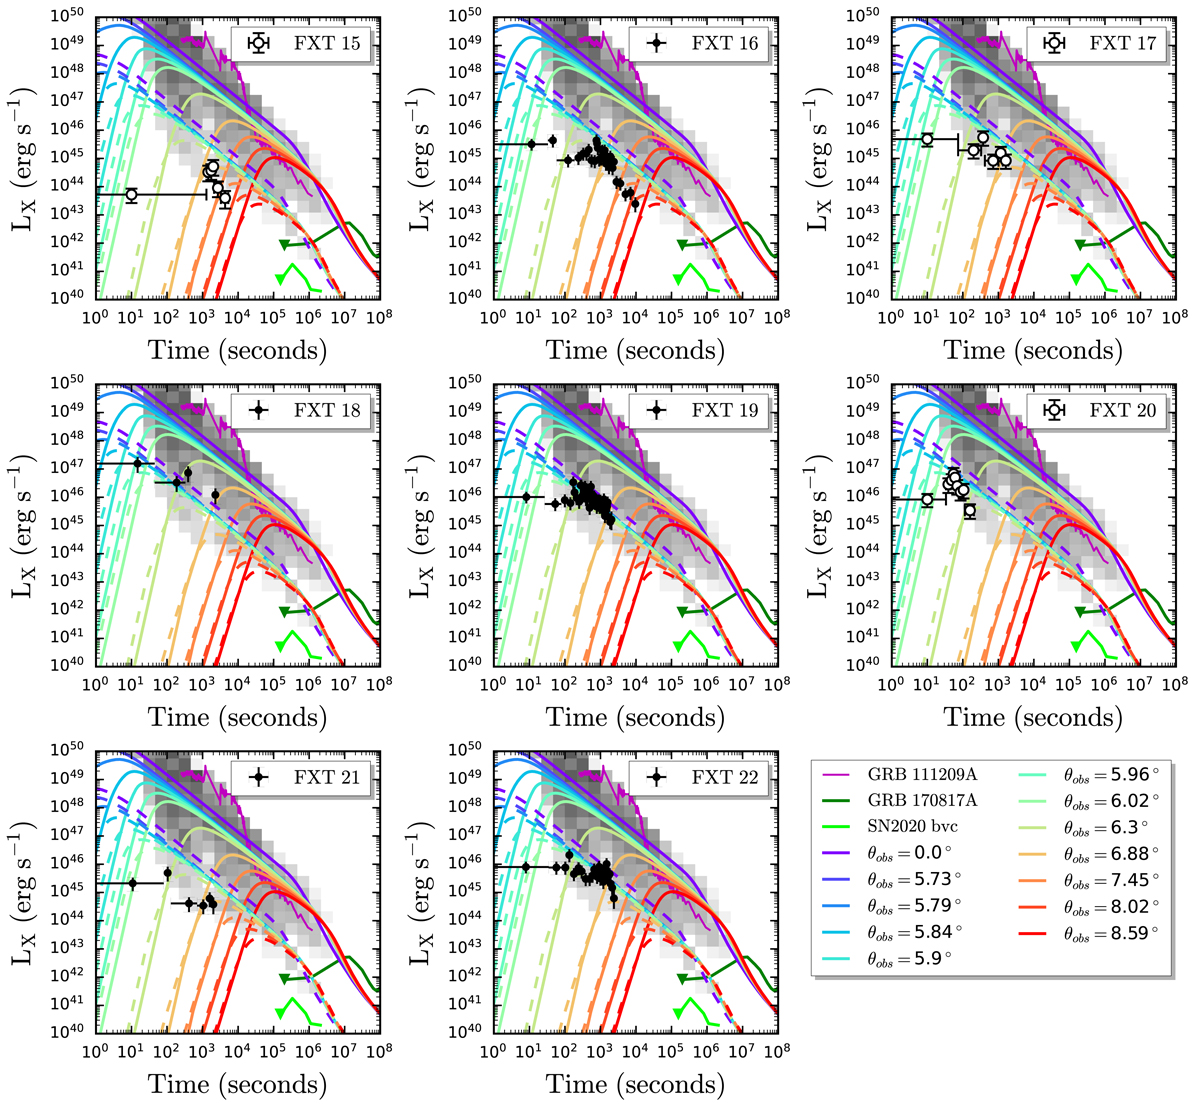
Fig. 19.
Download original image
Similar to Fig. 18. The X-ray afterglow light curves of 64 LGRBs plus 32 SGRBs (taken from Bernardini et al. 2012; Lü et al. 2015) are shown as a 2D histogram, while several individual transients are overplotted: GRB 111209A (ultra-long duration LGRB; solid magenta line, z = 0.677; Levan et al. 2014); GRB 170817A (off-axis SGRB, multiplied by ×1000; solid dark green line; Nynka et al. 2018; D’Avanzo et al. 2018; Troja et al. 2020, 2022); SN 2020bvc (the first off-axis LGRB candidate; solid light green line; Izzo et al. 2020), and theoretical off-axis GRB afterglows at different viewing angles θobs (solid and dashed colour lines represents afterglows with isotropic-equivalent energy and circumburst density of 1053 erg, 1 cm−3 and 1051 erg, 0.15 cm−3, respectively; Berger 2014; Ryan et al. 2020; Chrimes et al. 2022). For FXTs 15, 17, 18, and 20 (open symbols), we assume z = 1.0, and for FXTs 16, 19, 21, and 22, we take the redshift values from Table 6.
Current usage metrics show cumulative count of Article Views (full-text article views including HTML views, PDF and ePub downloads, according to the available data) and Abstracts Views on Vision4Press platform.
Data correspond to usage on the plateform after 2015. The current usage metrics is available 48-96 hours after online publication and is updated daily on week days.
Initial download of the metrics may take a while.