Fig. 18.
Download original image
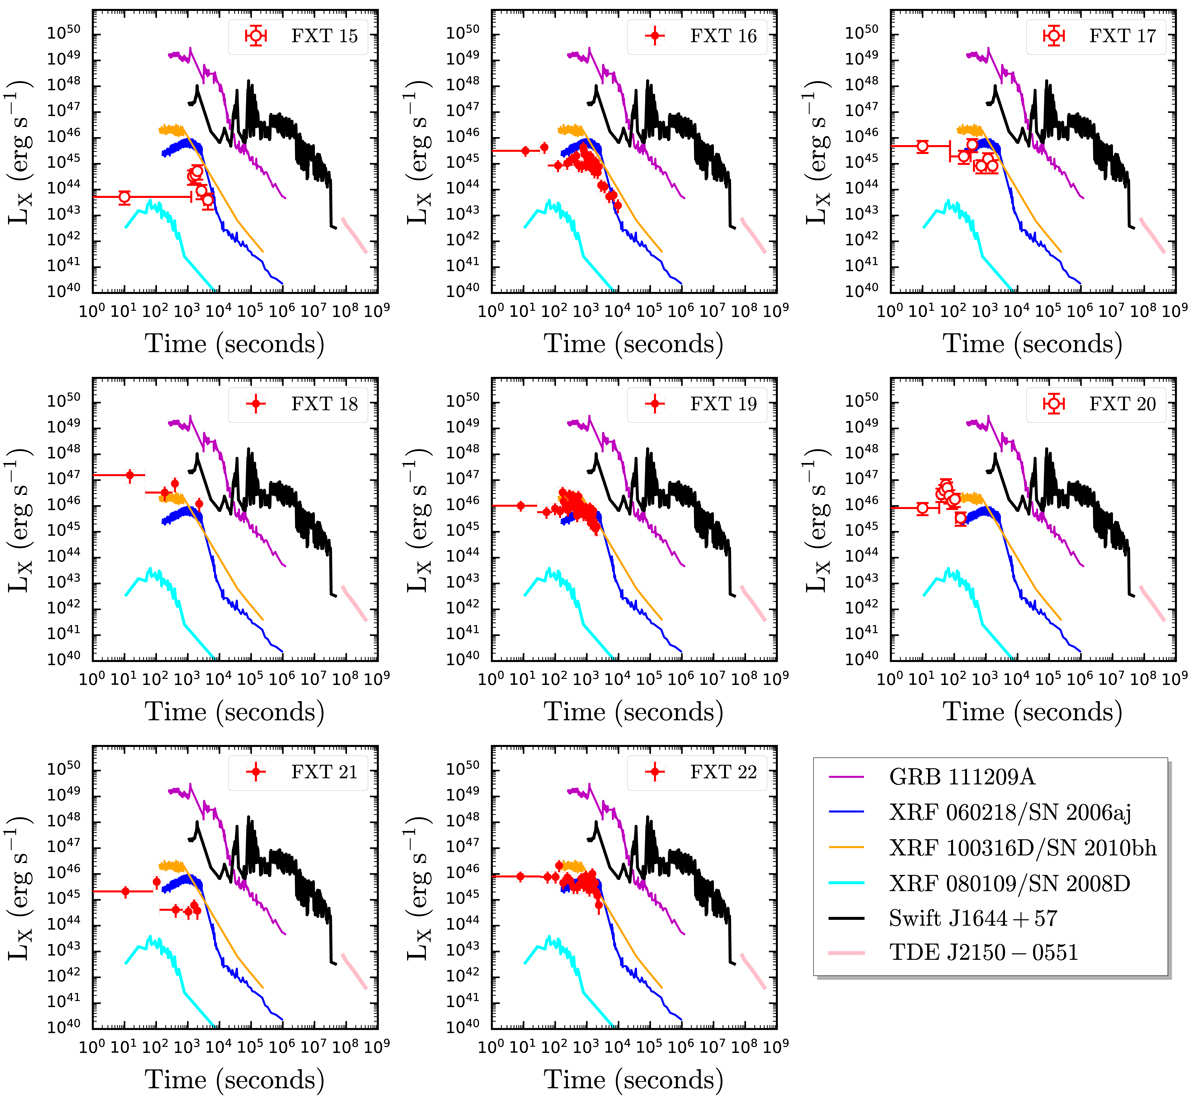
Light curves of the eight FXTs in 0.3–10 keV luminosity units (converted from 0.5–7 keV light curves assuming best-fit spectral models in Sect. 3.3). Several individual transients are overplotted: XRF 080109/SN 2008D (the low-luminosity supernova SBO; solid cyan lines, 27 Mpc); XRF 060218/SN 2006aj (solid blue lines, 145 Mpc); XRF 100316D/SN 2010bh (solid orange lines, 263 Mpc; Barniol Duran et al. 2015; Starling et al. 2011; Modjaz et al. 2009; Evans et al. 2009, 2007; Soderberg et al. 2008; Campana et al. 2006); GRB 110328A or Swift J1644+57 (relativistically beamed TDE; solid black lines, z = 0.3543; Bloom et al. 2011; Levan et al. 2011); J2150−0551 (unbeamed TDE; solid pink line, z = 0.055; Lin et al. 2018). For FXTs 15, 17, 18 and 20 (open symbols), we assume z = 1.0, and for FXTs 16, 19, 21, and 22 we take the redshift values from Table 6.
Current usage metrics show cumulative count of Article Views (full-text article views including HTML views, PDF and ePub downloads, according to the available data) and Abstracts Views on Vision4Press platform.
Data correspond to usage on the plateform after 2015. The current usage metrics is available 48-96 hours after online publication and is updated daily on week days.
Initial download of the metrics may take a while.