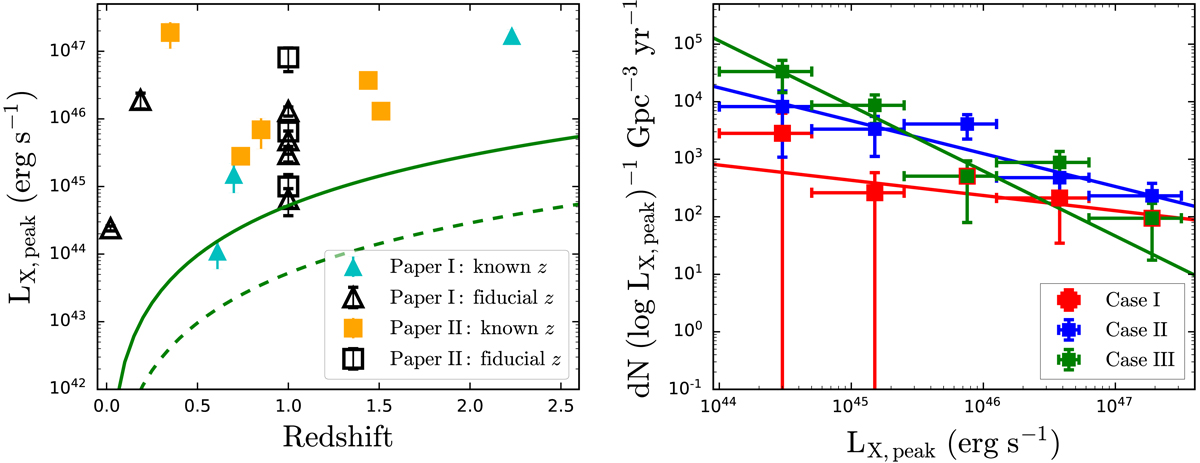
Fig. 16.
Download original image
Peak X-ray luminosity versus redshift and X-ray luminosity function of FXTs. Left panel: peak X-ray luminosity of FXT candidates from Paper I and this work (with known and fiducial redshifts; see Table 9). The green solid and dashed lines indicate peak flux limits of 10−13 (set by our algorithm) and 10−14 erg cm−2 s−1 (approximate Chandra on-axis detector limit), respectively. Right panel: FXT X-ray (0.3–10 keV) luminosity function (XLF) of the total sample from Paper I and this work. The red squares represent the XLF using the seven FXTs with known (photometric or spectroscopic) redshifts, while the blue and green squares show XLFs using all 17 FXTs with known+fiducial redshifts, adopting z = 1.0 and 0.5 for unknown objects, respectively. The solid lines show best-fit power-law models (see Table 10 for values).
Current usage metrics show cumulative count of Article Views (full-text article views including HTML views, PDF and ePub downloads, according to the available data) and Abstracts Views on Vision4Press platform.
Data correspond to usage on the plateform after 2015. The current usage metrics is available 48-96 hours after online publication and is updated daily on week days.
Initial download of the metrics may take a while.