Fig. 15.
Download original image
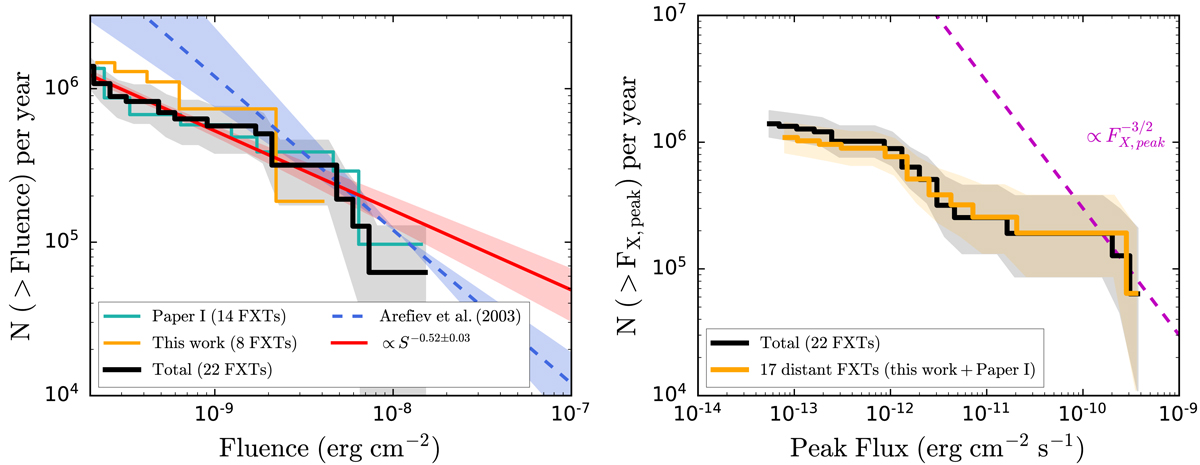
Observed cumulative log𝒩–log S and log𝒩–log Fpeak distributions. Left panel: log𝒩–log S distribution of the sample of extragalactic FXTs analyzed in this work (orange line), from Paper I (cyan line), and combined (black line), as a function of fluence (in cgs units). Also shown are two PL models, N(> Fluence)∝S−γ, with slopes γ = 0.52 (red line) and 1.0 (blue dashed line). The γ = 1 line represents the best fit and 1σ error of Arefiev et al. (2003) based on bright FXTs (including Galactic flares). The brightest sources in our sample appear to be consistent with this bright-end extrapolation, although our fainter sources fall up to ∼1 dex below, implying a break. For comparison with Arefiev et al. (2003), we convert all FXT fluences to the 2−10 keV band from their best fits. Right panel: log 𝒩–log Fpeak distribution of the total sample of extragalactic FXTs analyzed in Paper I and this work (black line) and only distant FXTs (orange line). The magenta dashed line shows objects uniformly distributed in Euclidean space (![]() ) for comparison. The color regions represent the 1-σ confidence interval.
) for comparison. The color regions represent the 1-σ confidence interval.
Current usage metrics show cumulative count of Article Views (full-text article views including HTML views, PDF and ePub downloads, according to the available data) and Abstracts Views on Vision4Press platform.
Data correspond to usage on the plateform after 2015. The current usage metrics is available 48-96 hours after online publication and is updated daily on week days.
Initial download of the metrics may take a while.