Fig. 13.
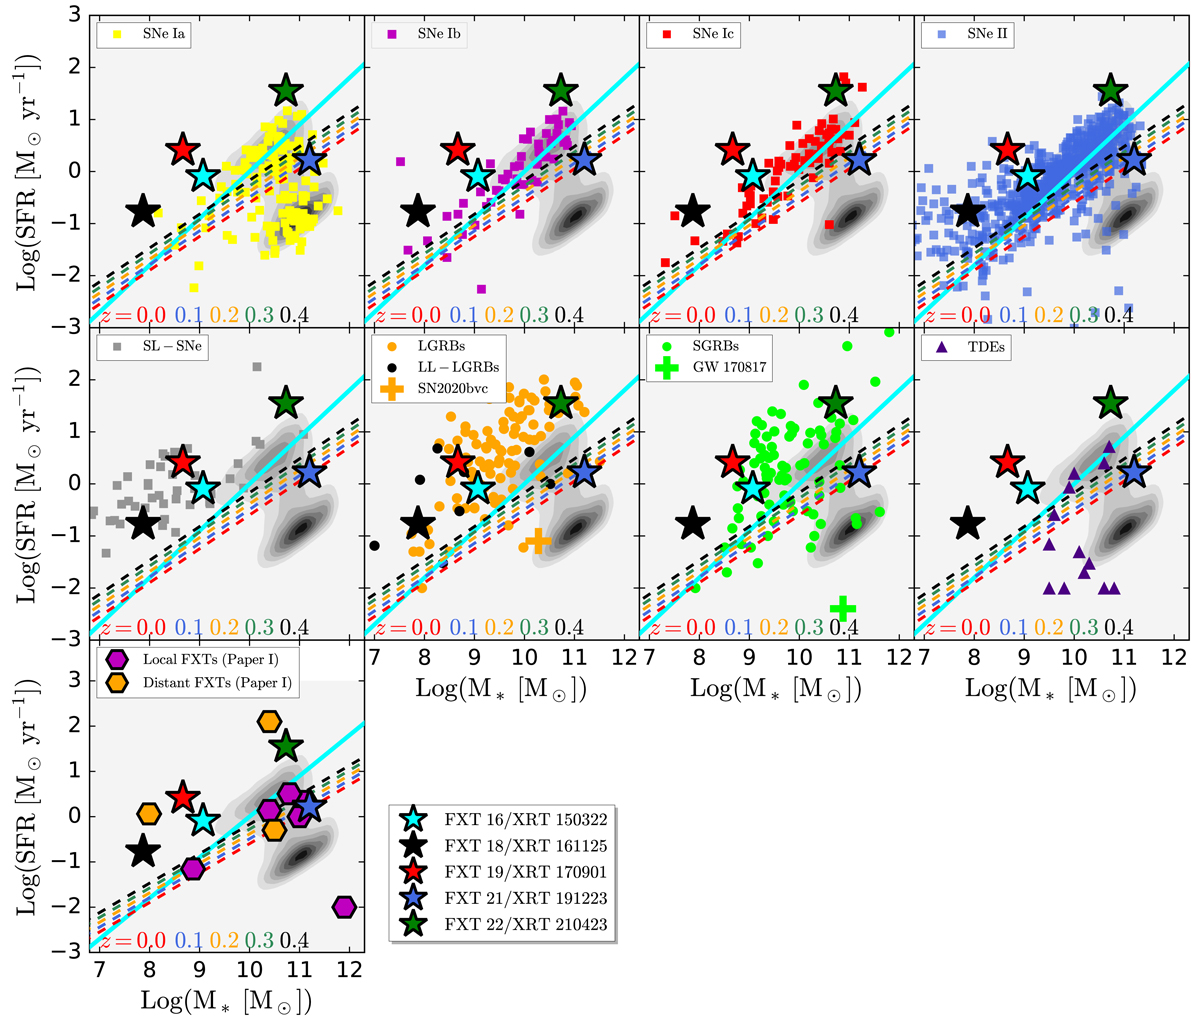
Download original image
Star-forming galaxy main sequence diagram, stellar mass vs. SFR, comparing hosts of FXTs and various other transient classes (one per panel) such as SNe type Ia, Ib, Ic, II (Tsvetkov & Bartunov 1993; Galbany et al. 2014; Schulze et al. 2021), super-luminous SNe (SL-SNe; Schulze et al. 2021), LGRBs (including SN 2020bvc; Chang et al. 2015; Li et al. 2016; Izzo et al. 2020; Ho et al. 2020), low-luminosity LGRBs (LL-LGRBs; GRB 980425, GRB 020903, GRB 030329, GRB 031203, GRB 050826, GRB 060218, and GRB 171205A; Christensen et al. 2008; Michałowski et al. 2014; Levesque 2014; Krühler et al. 2017; Wiersema et al. 2007; Wang et al. 2018; Arabsalmani et al. 2019), SGRBs (including GW 170817 or GRB 170817A; Li et al. 2016; Im et al. 2017; Nugent et al. 2022), TDEs (French et al. 2020), and Paper I FXT candidates (nearby and distant FXTs). Grayscale contours denote the SDSS galaxy distribution from Brinchmann et al. (2004). The solid cyan lines show the best-fit local galaxy main sequence relation from Peng et al. (2010), while the dashed colored lines denote the upward evolution of the boundary separating star-forming and quiescent galaxies as a function of redshift (at z = 0.0, 0.1, 0.2, 0.3, and 0.4; Moustakas et al. 2013).
Current usage metrics show cumulative count of Article Views (full-text article views including HTML views, PDF and ePub downloads, according to the available data) and Abstracts Views on Vision4Press platform.
Data correspond to usage on the plateform after 2015. The current usage metrics is available 48-96 hours after online publication and is updated daily on week days.
Initial download of the metrics may take a while.