Fig. 11.
Download original image
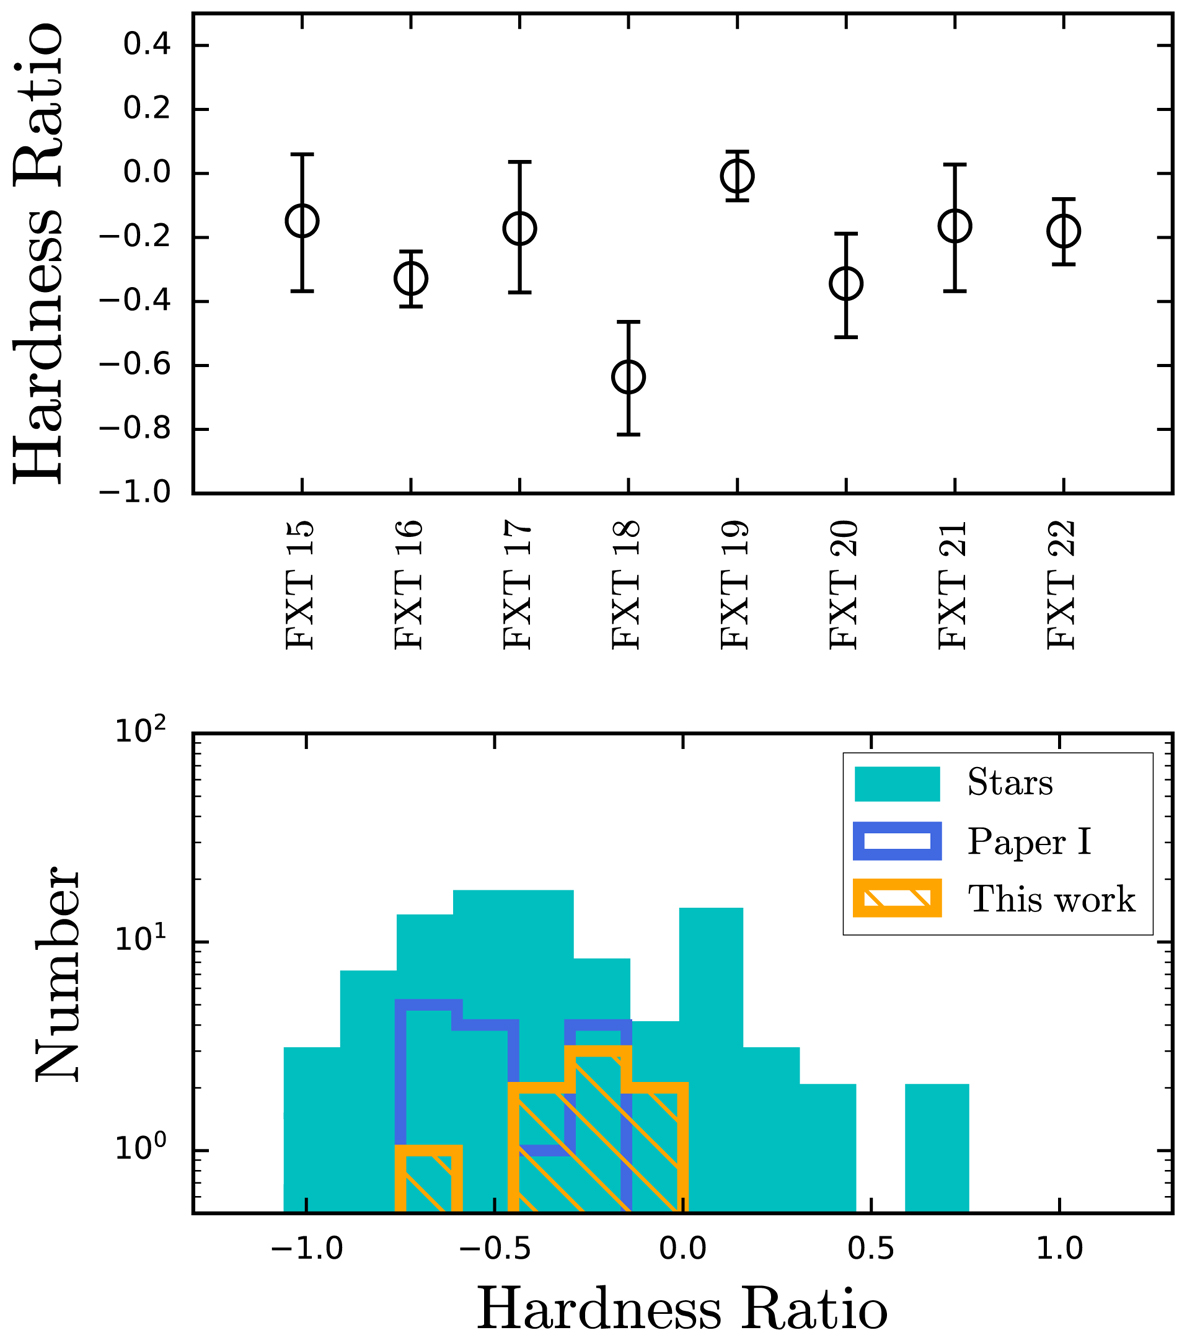
Hardness ratio comparison. Top panel: hardness ratio of each FXT candidate (using the Bayesian BEHR code; Park et al. 2006) at 1σ confidence level. Bottom panel: hardness-ratio distributions of our final samples of FXTs (orange histogram), compared to the X-ray transients classified as “stars” by Criterion 2 using Gaia (filled cyan histogram) and the sources identified previously as distant FXTs (blue histogram) by Paper I.
Current usage metrics show cumulative count of Article Views (full-text article views including HTML views, PDF and ePub downloads, according to the available data) and Abstracts Views on Vision4Press platform.
Data correspond to usage on the plateform after 2015. The current usage metrics is available 48-96 hours after online publication and is updated daily on week days.
Initial download of the metrics may take a while.