Fig. 5.
Download original image
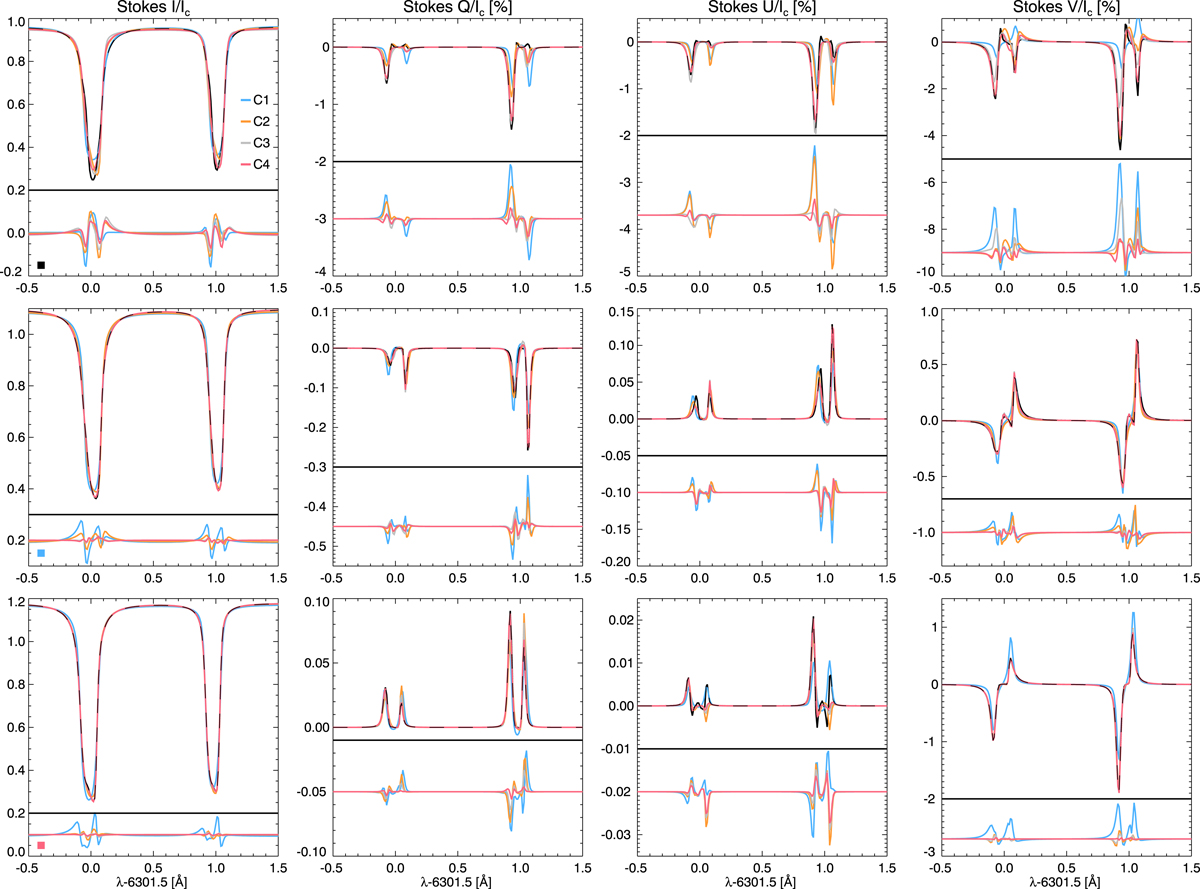
Stokes profiles corresponding to the three reference pixels (rows). From left to right, Stokes (I, Q, U, V), respectively. Black corresponds to the input profiles, while colours designate the Stokes parameters corresponding to the different node configurations presented in Table 1. Each panel includes the differences between the input and the inferred profiles below the horizontal solid black line. From top to bottom, each reference profile corresponds to an intergranular lane, edge of a granule, and top of a granule, respectively. We show the exact location in Fig. 11, where we provide a zoom onto the region highlighted in the top panel of Fig. 1.
Current usage metrics show cumulative count of Article Views (full-text article views including HTML views, PDF and ePub downloads, according to the available data) and Abstracts Views on Vision4Press platform.
Data correspond to usage on the plateform after 2015. The current usage metrics is available 48-96 hours after online publication and is updated daily on week days.
Initial download of the metrics may take a while.