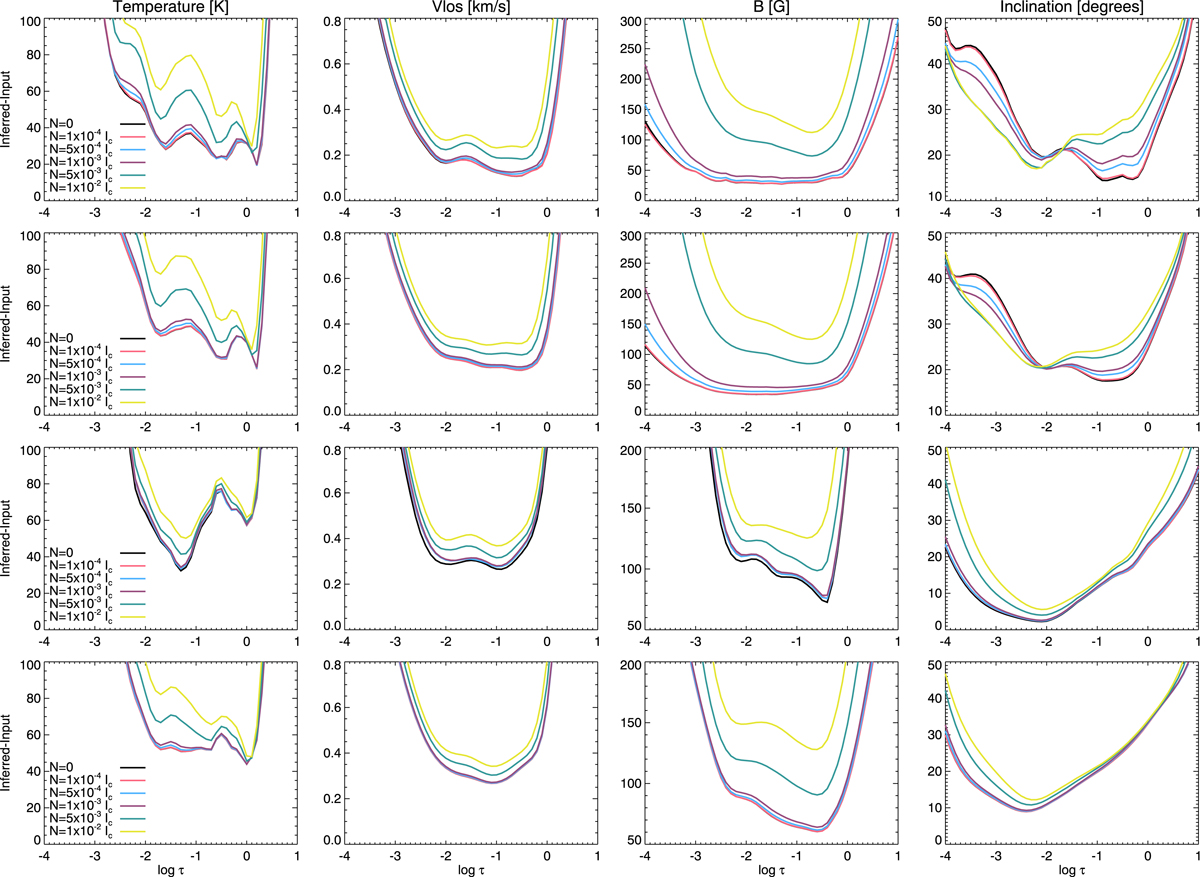
Fig. 13.
Download original image
Average differences between the input and the inferred atmosphere at different optical depths when adding noise to the synthetic profiles. From left to right, we show the differences for temperature, LOS velocity, magnetic field strength, and inclination, respectively. Colours correspond to the noise values indicated in the leftmost column. Rows are associated with different reference FOVs, with the top, second, third, and the bottom row corresponding to the region inside the orange box, the complete Mancha FOV, the region inside the blue box, and the complete FOV of the MURaM run presented in Fig. 1, respectively.
Current usage metrics show cumulative count of Article Views (full-text article views including HTML views, PDF and ePub downloads, according to the available data) and Abstracts Views on Vision4Press platform.
Data correspond to usage on the plateform after 2015. The current usage metrics is available 48-96 hours after online publication and is updated daily on week days.
Initial download of the metrics may take a while.