Fig. 12.
Download original image
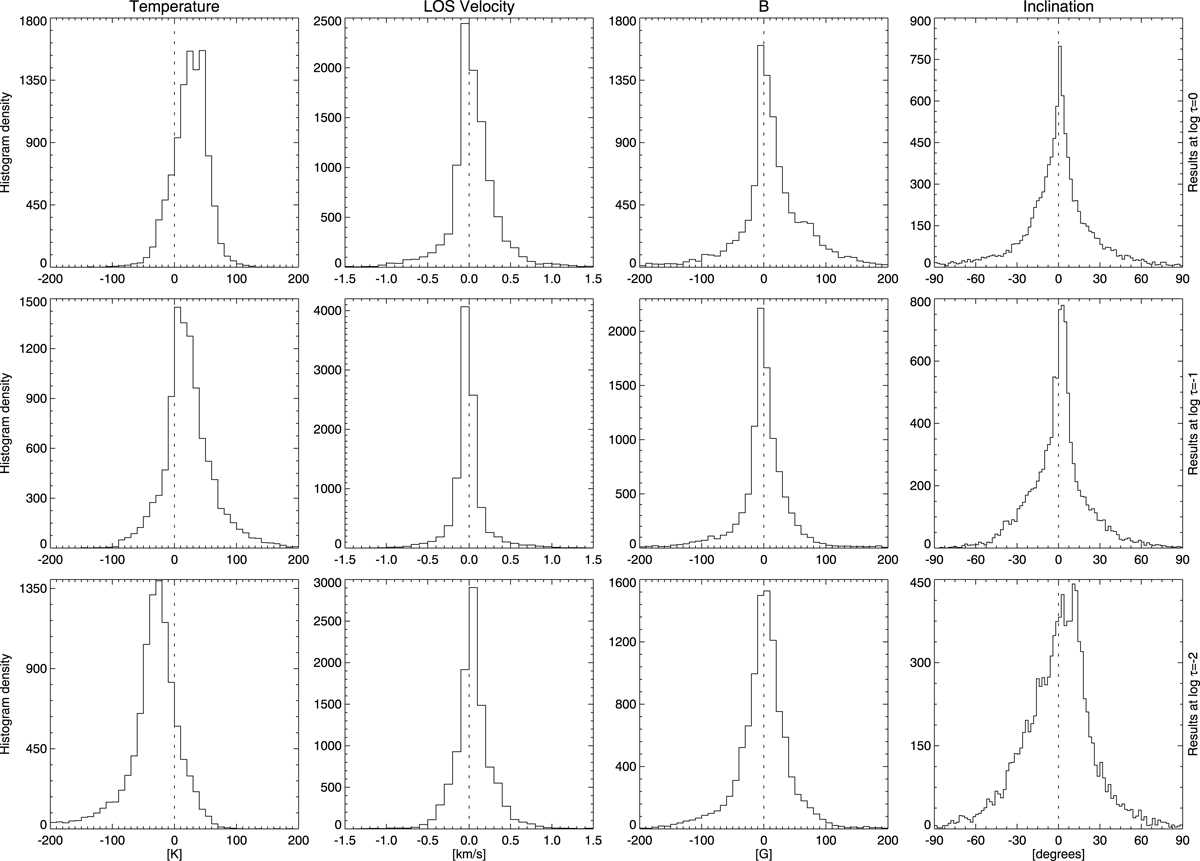
Histogram containing the differences between the inferred and the input atmosphere at selected optical depths for the region enclosed by the orange square in Fig. 1. The differences in temperature, LOS velocity, magnetic field strength, and inclination are shown from left to right. Each row corresponds, from top to bottom, to reference layers at log τ500 = [0, −1, −2]. The bin size is 10 K, 0.1 km s−1, 10 G, and 2 degrees, respectively.
Current usage metrics show cumulative count of Article Views (full-text article views including HTML views, PDF and ePub downloads, according to the available data) and Abstracts Views on Vision4Press platform.
Data correspond to usage on the plateform after 2015. The current usage metrics is available 48-96 hours after online publication and is updated daily on week days.
Initial download of the metrics may take a while.