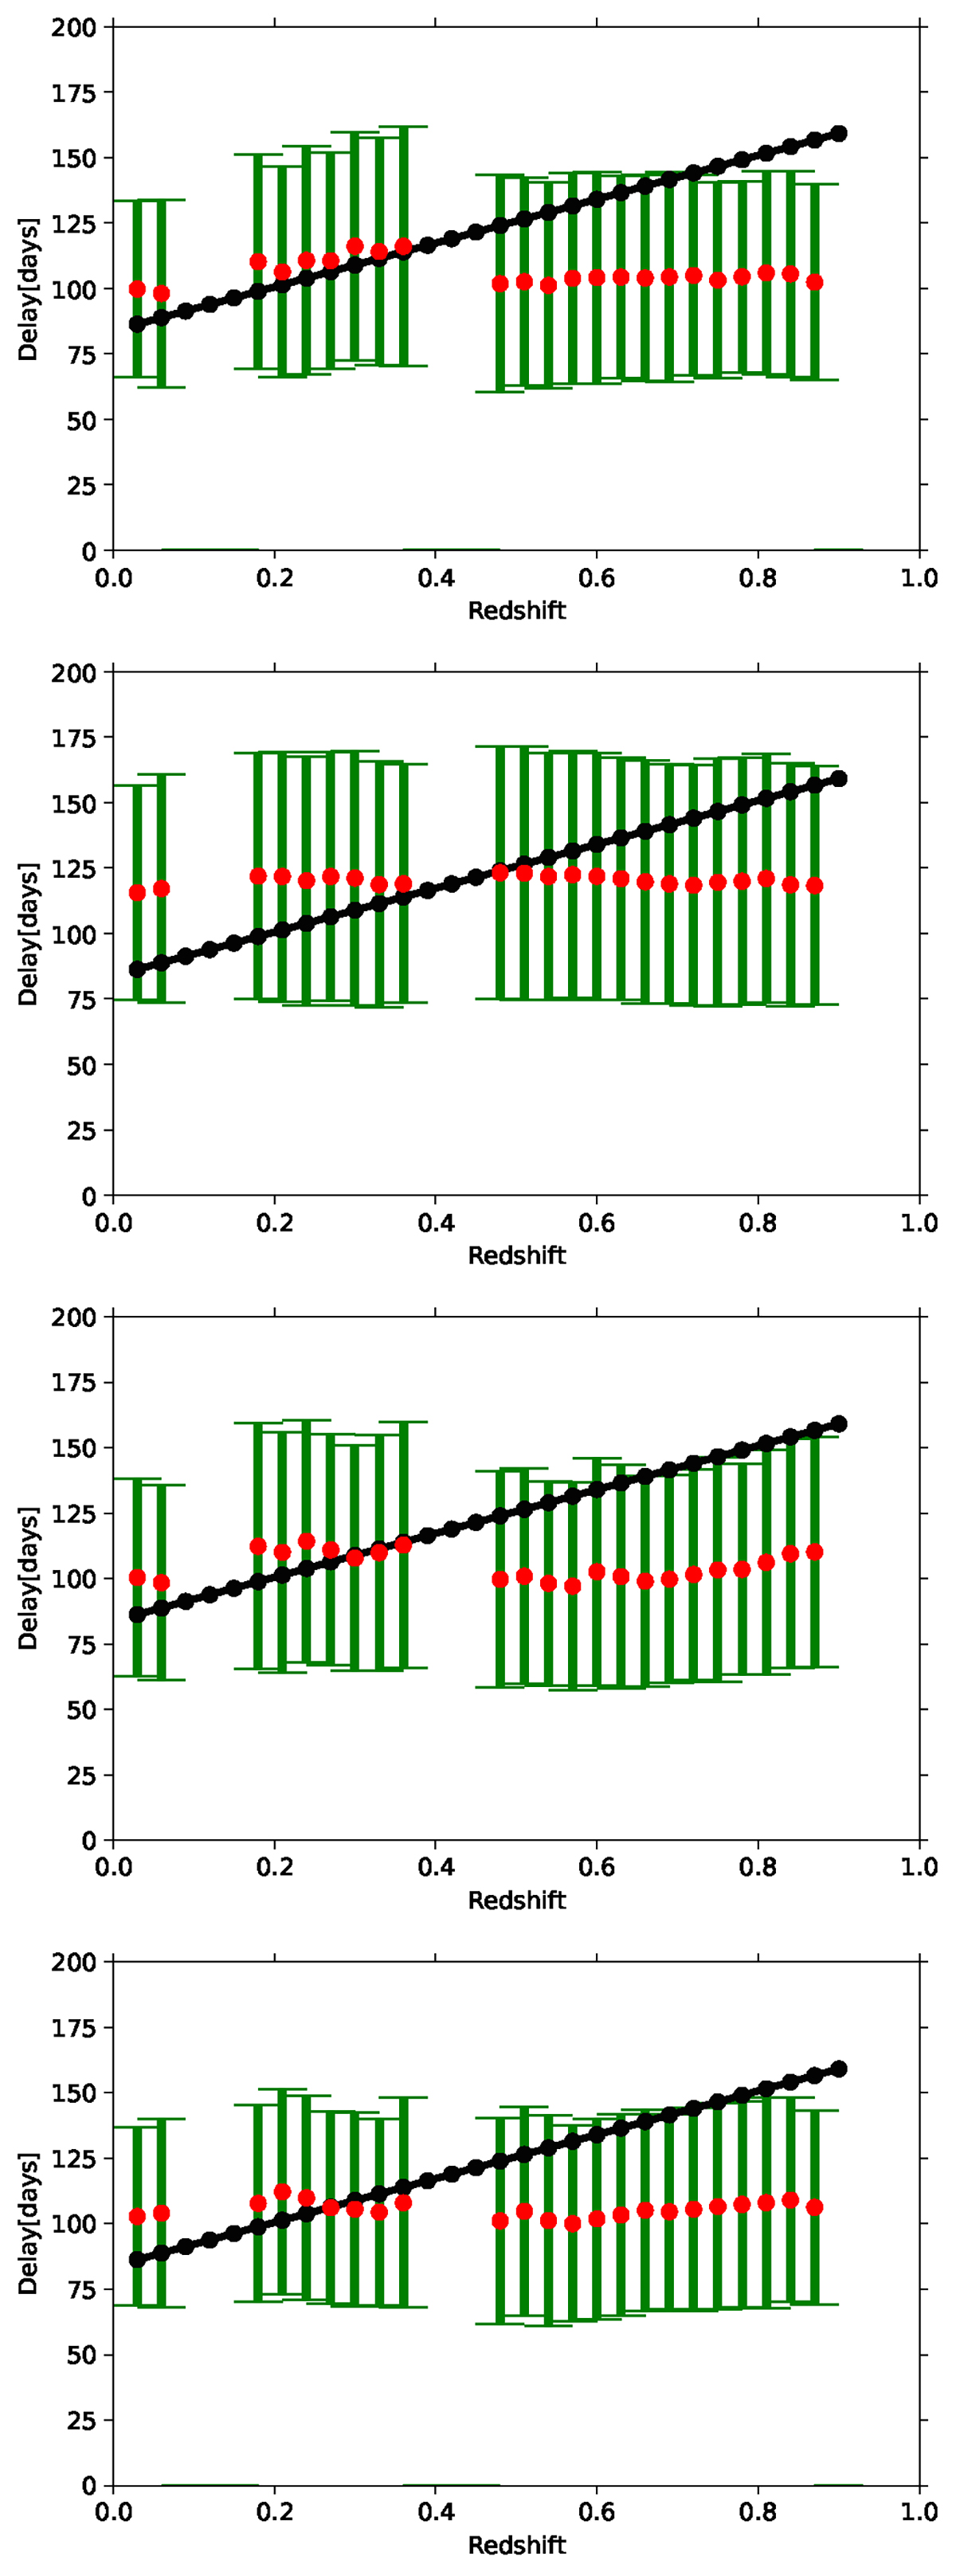
Fig. 9.
Download original image
Sensitivity of the simulations to the assumed parameter for the first year of DDF data, faint quasars log L3000 = 44.7. Top panel: alternative values of the line EWs. Second panel: assuming a larger photometric error. Third panel: at shorter timescales for the frequency breaks of the power spectrum. Lowest panel: at lower variability amplitude (see Sect. 3.4 for details).
Current usage metrics show cumulative count of Article Views (full-text article views including HTML views, PDF and ePub downloads, according to the available data) and Abstracts Views on Vision4Press platform.
Data correspond to usage on the plateform after 2015. The current usage metrics is available 48-96 hours after online publication and is updated daily on week days.
Initial download of the metrics may take a while.