Fig. 5.
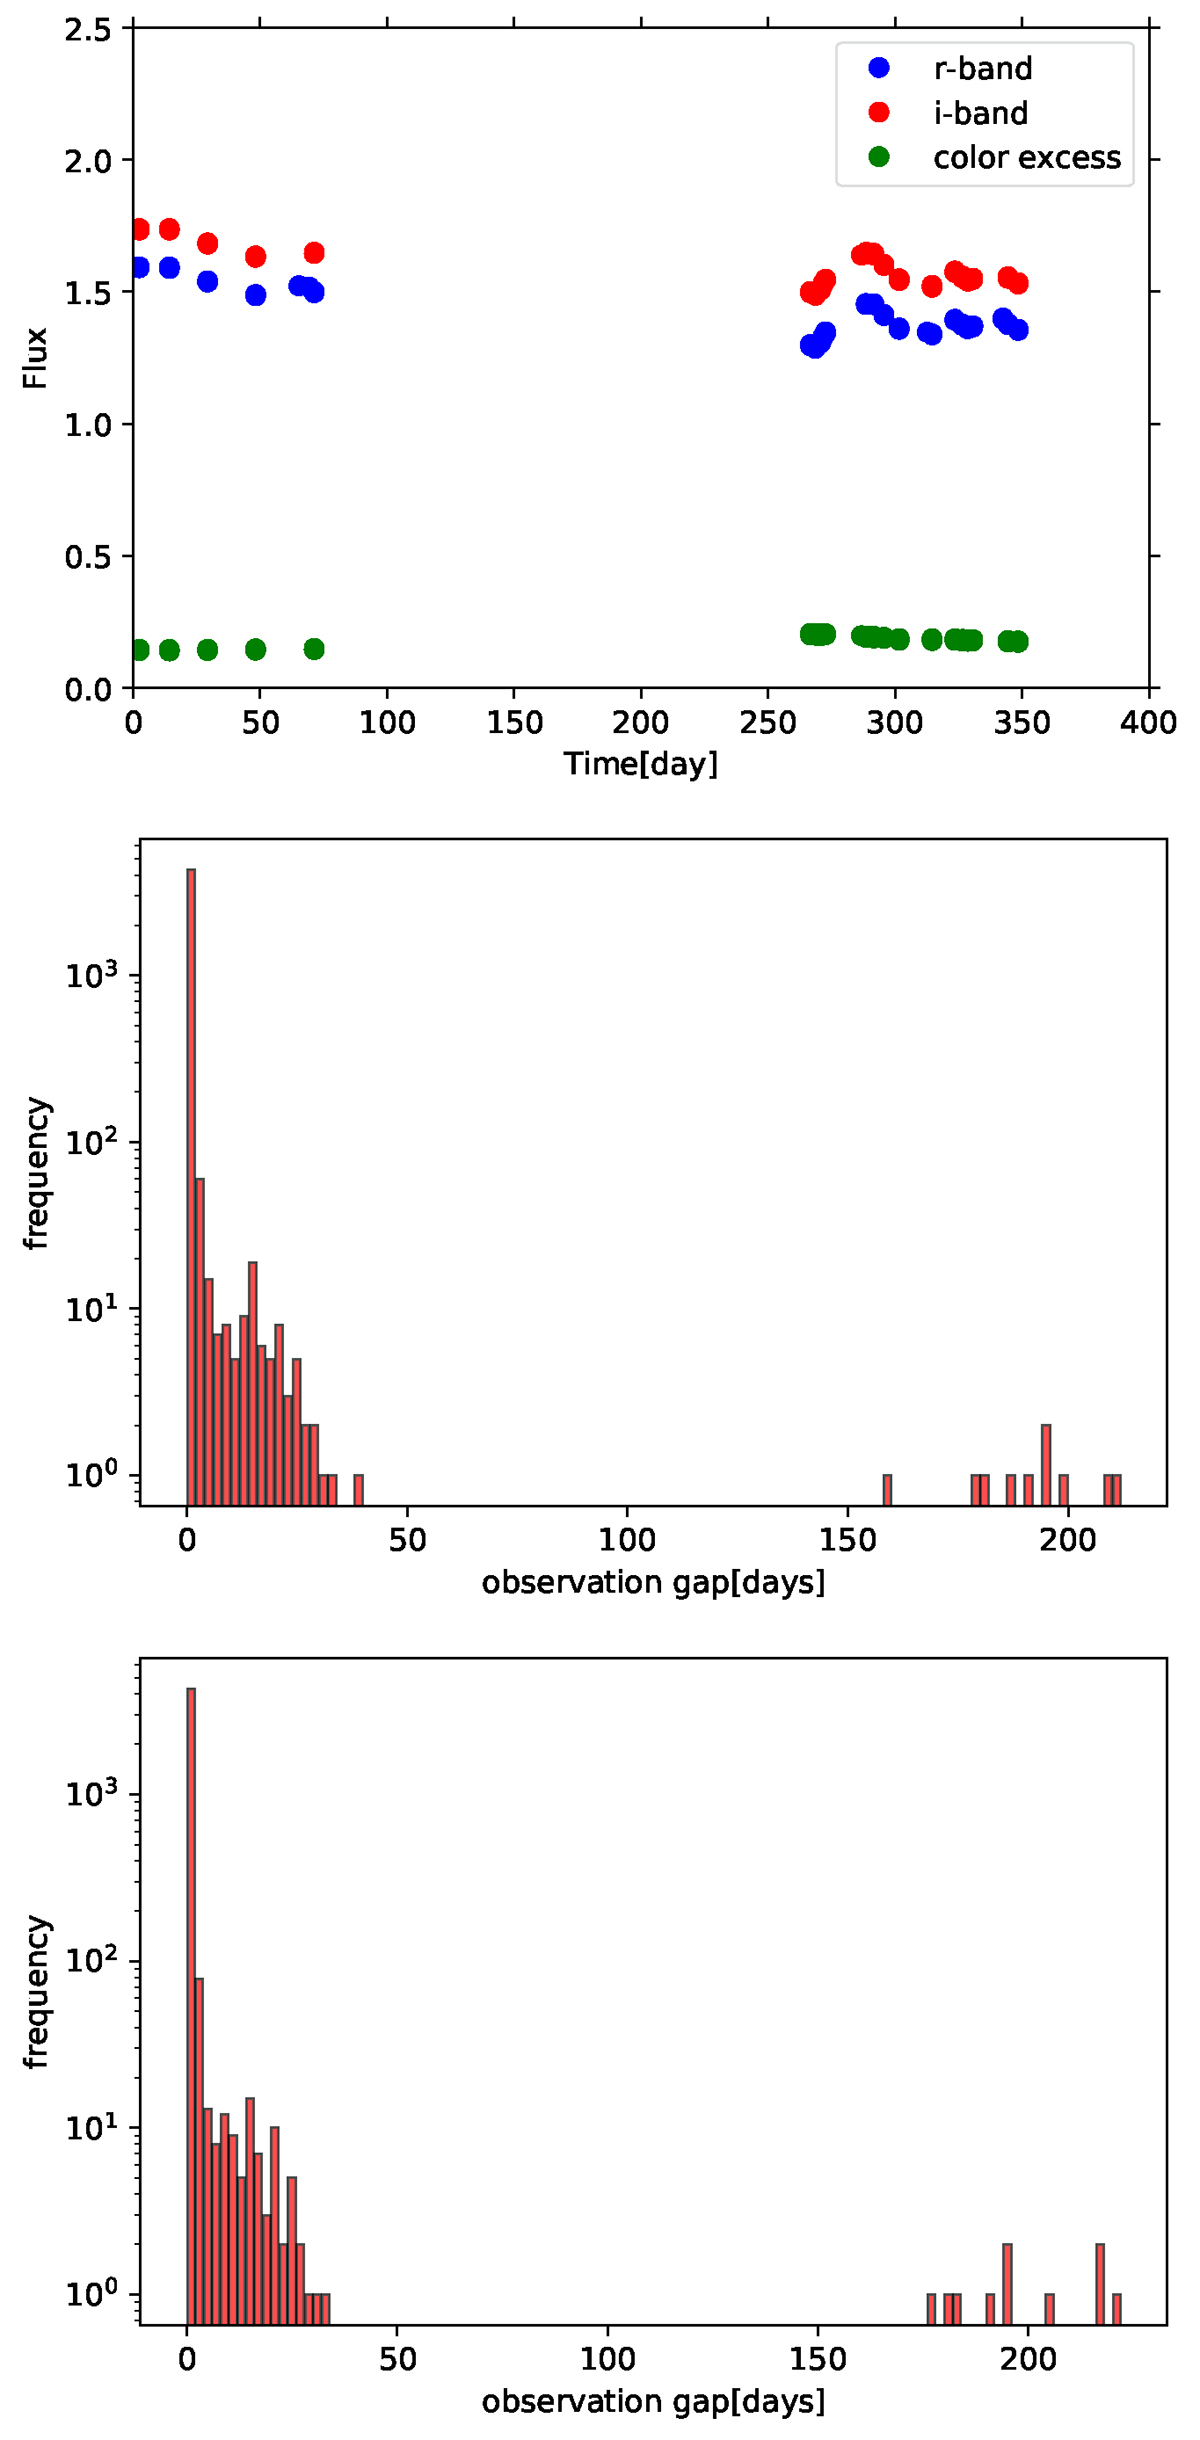
Download original image
Illustration of the DDF cadence issues. Upper panel: example of the artificial light curve for the first year of observing with DDF cadence in i band (blue circles) and in r band, contaminated by CIV line. Green points represent the net contamination for ϵi = 1.0 (see Eq. (2)). The delay is calculated between the green and the blue points. We adopt standard values of parameters from Table 2, z = 3.276. Middle panel: Histogram of the time separation between the consecutive observation dates in r band in the selected DDF field during the whole ten years. Lower panel: same for the i band.
Current usage metrics show cumulative count of Article Views (full-text article views including HTML views, PDF and ePub downloads, according to the available data) and Abstracts Views on Vision4Press platform.
Data correspond to usage on the plateform after 2015. The current usage metrics is available 48-96 hours after online publication and is updated daily on week days.
Initial download of the metrics may take a while.