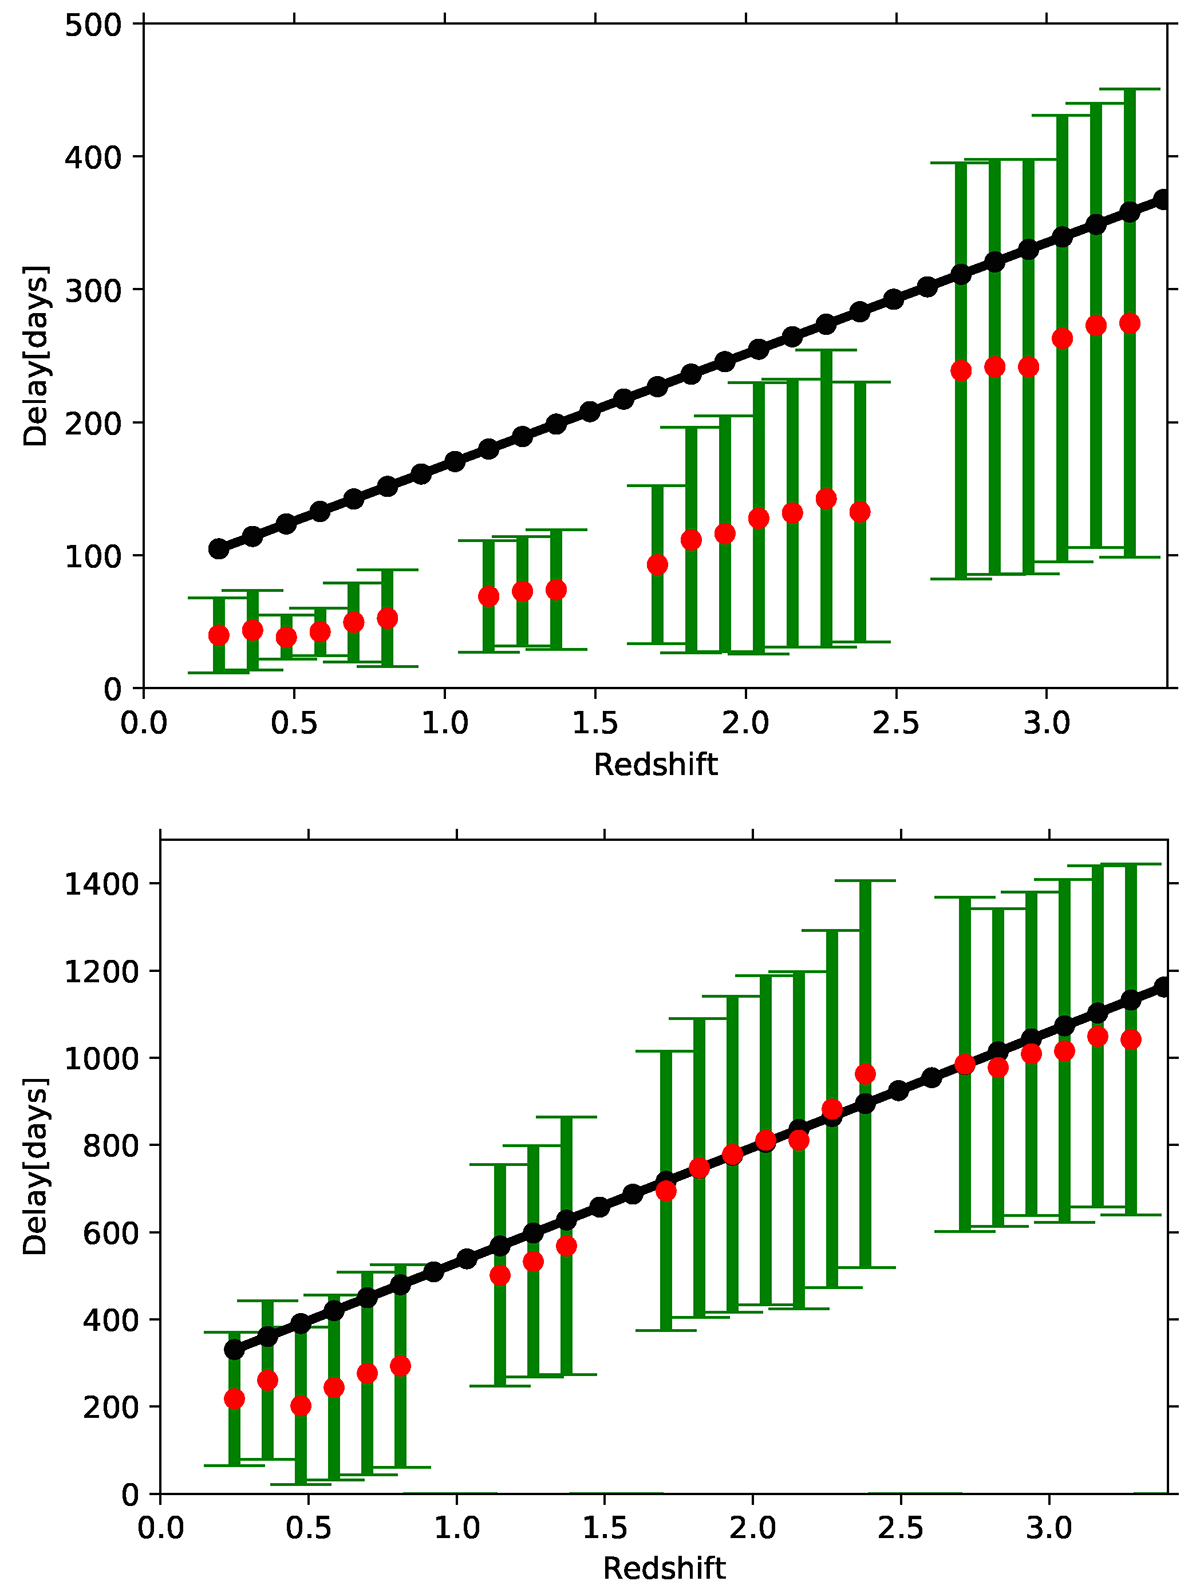
Fig. 4.
Download original image
Adopted (black points) and mean recovered (red points) time delay as a function of redshift for faint AGN (log L3000 = 44.7, upper panel) and for bright AGN (log L3000 = 45.7, lower panel) from the main survey. Green error bars are the standard deviation that is expected in a single source measurement, as determined by the use of 100 statistically equivalent simulations. The error of the mean recovered delay is 10% of the dispersion. The other parameters have the standard values given in Table 2. The redshift gaps correspond to no satisfactory selection of the contaminated and uncontaminated bands.
Current usage metrics show cumulative count of Article Views (full-text article views including HTML views, PDF and ePub downloads, according to the available data) and Abstracts Views on Vision4Press platform.
Data correspond to usage on the plateform after 2015. The current usage metrics is available 48-96 hours after online publication and is updated daily on week days.
Initial download of the metrics may take a while.